air quality assessment, UK air quality, air pollution monitoring, NO2 limit values, air quality reporting
Air Quality Assessment Explained for UK Projects
By ESG Consulting Team · · 16 min read
You're preparing a project brief for a site beside a busy road. The planning team wants an air quality assessment, the facilities team already has sensor readings, and someone has suggested using the nearest monitoring station. Before commissioning more work, you need to know whether any of that evidence answers the question your project faces.
A defensible assessment connects the concentration measured or predicted, the place people are exposed, the relevant benchmark and the decision that follows. That chain usually breaks when a team chooses the wrong receptor, trusts an unsuitable instrument or treats a background reading as representative of a roadside entrance.
Table of Contents
- Pollutants and Limit Values Every Assessment Covers
- UK Regulatory Framework and Who Sets the Limits
- Choosing Between Monitoring and Modelling
- Instrument Grades and Why Data Quality Decides Compliance
- How to Run an Assessment Step by Step
- Reading Results Against Baselines and Trends
- Reporting Results Your Auditor Can Trace
- Scope Your Assessment Before Work Starts
Pollutants and Limit Values Every Assessment Covers
A planning consultant assessing a development beside a busy road must decide what to measure before anyone picks up an instrument. An air quality assessment is a structured check of pollutant concentrations against applicable legal and health benchmarks, at the specific places and times people are exposed.
Start with the source, not a shopping list of sensors. Traffic, construction activity and combustion equipment raise different questions, so the pollutant list should reflect what the project emits, changes or brings people into contact with.
Nitrogen dioxide (NO2) and particulate matter (PM10 and PM2.5) are usually the first pollutants to investigate for road, construction and combustion projects. Sulphur dioxide, carbon monoxide and ozone also belong in the initial screening discussion, but they won't necessarily require detailed assessment on every project.
Match the concentration to the averaging period
An annual mean describes longer-term conditions. An hourly mean tests shorter episodes, while a rolling average is recalculated as successive measurements enter and leave the averaging window.
These aren't interchangeable results. A short reading above an annual benchmark doesn't establish an annual exceedance, and a satisfactory annual mean doesn't resolve every question about pollution peaks.
Some benchmarks also allow a specified number of exceedances. The assessment must therefore identify both the concentration threshold and the rule for counting exceedances, rather than marking every high reading as a failure.
UK air quality limit and target values
The threshold schedule below identifies the checks needed before commissioning. Only the numerical limit supported by the cited compliance assessment is reproduced; the remaining legal values and allowances need confirmation against the applicable regulations rather than an unverified summary.
| Pollutant | Averaging period | Limit or target value | Permitted exceedances |
|---|---|---|---|
| NO2 | Hourly mean | Confirm the applicable short-term limit | Confirm the annual allowance |
| NO2 | Annual mean | Confirm the applicable annual limit | Annual compliance comparison |
| PM10 | Daily mean | Confirm the applicable daily limit | Confirm the annual allowance |
| PM10 | Annual mean | Confirm the applicable annual limit | Annual compliance comparison |
| PM2.5 | Annual mean | Confirm the applicable limit and any separate target | Apply the relevant annual assessment rule |
| SO2 | Hourly mean | Confirm the applicable hourly limit | Confirm the annual allowance |
| SO2 | Daily mean | Confirm the applicable daily limit | Confirm the annual allowance |
| CO | Rolling eight-hour mean | Confirm the applicable concentration and units | Apply the maximum daily value rule |
| Ozone | Rolling eight-hour mean | Confirm the applicable target value | Confirm the permitted days and multi-year assessment rule |
This is a scoping schedule, not a complete legal threshold register. Before using it for a compliance decision, record the operative legislation, geographical coverage, exposure conditions and assessment year. Keep current obligations separate from future targets.
Read the completed schedule horizontally: identify the pollutant, select its averaging period, then apply its exceedance rule. Checking units matters too, particularly where a benchmark uses milligrams rather than micrograms.
UK Regulatory Framework and Who Sets the Limits
A local authority officer reviewing a proposed road scheme needs more than a statement that air quality is improving. They need to know whether the proposal could change exposure at relevant locations and whether the applicant's evidence is proportionate to that risk.
National compliance reporting, local air quality management and project assessment serve different purposes. Treating them as interchangeable can produce a technically detailed report that answers the wrong regulatory question.
The UK ambient-air framework uses statutory standards, while local authorities review conditions through Local Air Quality Management. Where the applicable local objectives aren't being achieved, the authority may need to designate an Air Quality Management Area and prepare an action plan. For project scoping, check the relevant nation's requirements and the authority's current assessment and planning guidance.
Identify the route into assessment
| Project route | Main question to resolve | Scope to agree |
|---|---|---|
| Planning application or environmental impact assessment | How could the proposal change exposure at sensitive receptors? | Baseline, development scenarios, affected locations and mitigation |
| Environmental permit | What local impact could the regulated source cause? | Emissions, operating conditions, dispersion and assessment criteria |
| Consent condition or reporting obligation | Has the specified monitoring or performance requirement been met? | Named programme, acceptance rules and reporting format |
An Air Quality Management Area designation is a scoping flag, not a substitute for examining the proposal. Equally, a site outside a designated area shouldn't be dismissed without checking nearby sources and exposed people.
Commissioning rule: Ask the decision-maker to agree the assessment question before agreeing the equipment or model.
Write that agreement into the brief. Name the planning condition, permit requirement or reporting obligation, identify who will review the work, and record which benchmarks they expect.
The same pollutant result may support different conclusions under different routes. A planning judgement about the significance of a predicted change isn't identical to a national compliance determination or a check against a permit condition.
Choosing Between Monitoring and Modelling
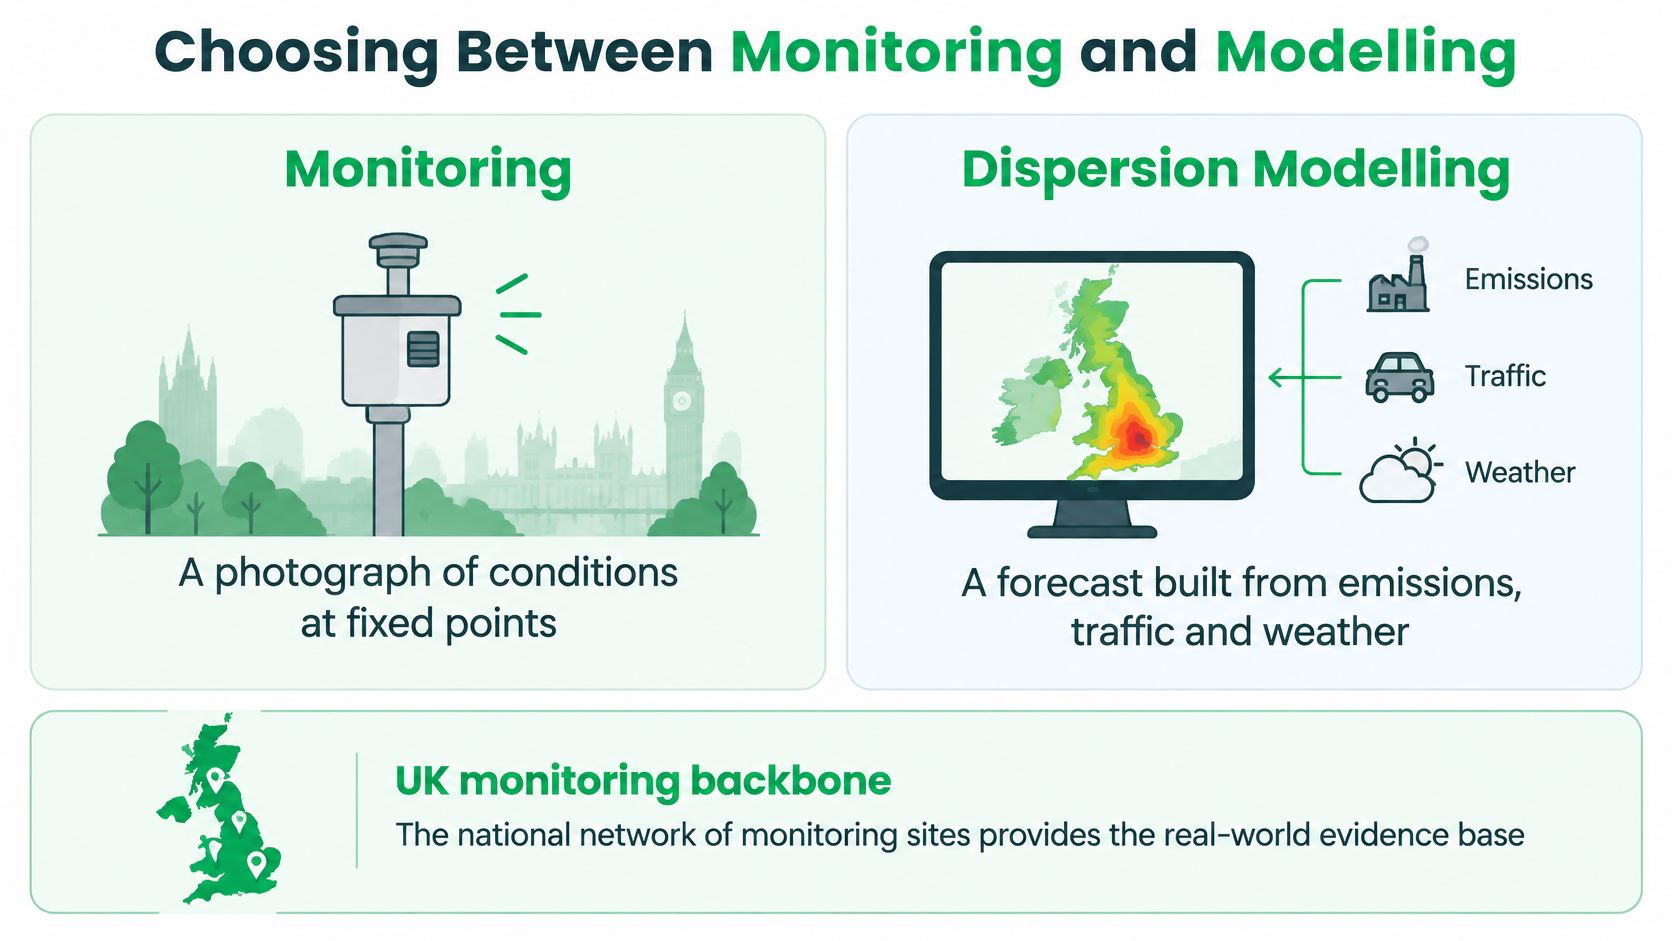
Monitoring is a photograph of conditions at fixed points; dispersion modelling is a forecast built from emissions, traffic and weather. Neither is the better method. Their value depends on the question you're asking.
The comparison below helps separate existing exposure from predicted change.
Monitoring, modelling and desk review compared
| Method | What it produces | Best for | Main limitation |
|---|---|---|---|
| On-site monitoring | Measured concentrations over time at fixed points | Existing exposure and compliance evidence where methods meet requirements | Describes the locations and periods actually monitored |
| Dispersion modelling | Predicted concentrations across receptors or a grid | Future change from roads, plant or traffic | Relies on emissions inputs and needs verification against suitable measurements |
| Desk-based background review | Published annual-mean background estimates and nearest-station data | Early scoping and screening | Cannot reliably reveal site-specific hotspots |
The Automatic Urban and Rural Network (AURN) is the UK's principal high-quality automatic monitoring network and its main network for ambient-air compliance reporting; Defra's NO2 compliance assessment compares annual mean NO2 with 40 µg/m³ for relevant public exposure and reports that 143 stations met the assessment's data-quality requirements in 2025.
That distinction matters: having a concentration isn't enough. The measurement must also meet the relevant quality and exposure requirements.
Choose a representative location
A roadside station captures traffic-influenced conditions. An urban-background station describes broader conditions away from the immediate influence of a particular road.
Suppose your proposed reception entrance faces a queue of vehicles. A background station in a nearby residential park may help describe surrounding conditions, but it doesn't establish the concentration at that entrance.
For a fuller visual introduction to the methods, the following video provides additional context.
Use monitoring to investigate what people encounter now. Use modelling to examine what changes under a proposed development or operating scenario. Combining them often provides the strongest basis for a decision, with measured evidence used to check the model's performance.
Model verification isn't permission to adjust inputs until a preferred answer appears. Keep the comparison, adjustments and remaining uncertainty visible.
Before commissioning either method, complete a desk review to identify likely sources, receptors and evidence gaps. Then ask the deciding question: is the issue existing exposure, future change, or both?
Instrument Grades and Why Data Quality Decides Compliance
More sensors don't automatically mean a better assessment. A dense network of poorly characterised devices can produce a detailed-looking map without establishing whether its concentrations are reliable.
The instrument's evidence weight comes from its demonstrated performance and the monitoring programme around it. A dashboard doesn't confer compliance status.
Instrument grades and the evidence they support
| Instrument class | Typical use | Evidence weight | Controls to document |
|---|---|---|---|
| Reference gravimetric PM method | Compliance measurement for PM2.5 and PM10 | Compliance evidence within a valid programme | Calibration, sample handling, QA/QC and data capture |
| Demonstrated-equivalent automatic analyser | Continuous compliance monitoring | Compliance evidence where equivalence and programme requirements are met | Equivalence status, uncertainty, maintenance and performance checks |
| Passive NO2 diffusion tube | Spatial screening across multiple sites | Supporting evidence after appropriate adjustment and review | Bias adjustment, exposure period, laboratory arrangements and co-location |
| Certified indicative particulate monitor | Screening and hotspot identification | Indicative evidence, not automatically compliance evidence | Certification scope, siting and data capture |
| Uncertified low-cost gaseous sensor | Hotspot and trend screening | Indicative evidence only | Co-location, data-quality flags, interference checks and uncertainty |
For particulate compliance measurement, UK monitoring-instrument guidance identifies BS EN 12341:2023 as the gravimetric reference method for PM2.5 and PM10, with a 25% uncertainty objective at the limit value for equivalent analysers.
That uncertainty objective is an instrument-performance requirement, not a tolerance you can add to a legal limit. Nor does equivalence remove the need for correct siting, maintenance and data validation.
Use screening instruments without overstating them
Defra's Local Air Quality Management guidance on low-cost sensors identifies accuracy and precision trade-offs and states that there isn't currently a certification scheme for low-cost gaseous sensors covering NO2, CO, ozone and SO2, while some particulate monitors have certification for indicative monitoring.
A sensor can still help locate a recurring hotspot or investigate when a source operates. The mistake is promoting that screening result into a compliance conclusion without additional evidence.
A repeatable reading isn't necessarily an accurate reading. An instrument can produce consistent results with a systematic bias.
For example, a sensor installed beside a loading area might indicate peaks during deliveries. Check its response against a trusted instrument and compare the timing with activity logs before attributing those peaks to vehicle exhaust.
Set escalation rules before deployment. Specify which findings trigger co-location, instrument servicing, reference-quality confirmation or a change in assessment method. Keep the instrument's limitations attached to its results throughout reporting.
How to Run an Assessment Step by Step
Begin with the decision you need to support, then collect the evidence required to support it. This prevents a familiar problem: receiving a large dataset and discovering that it doesn't cover the relevant exposure.
The process graphic provides an overview of the workflow.
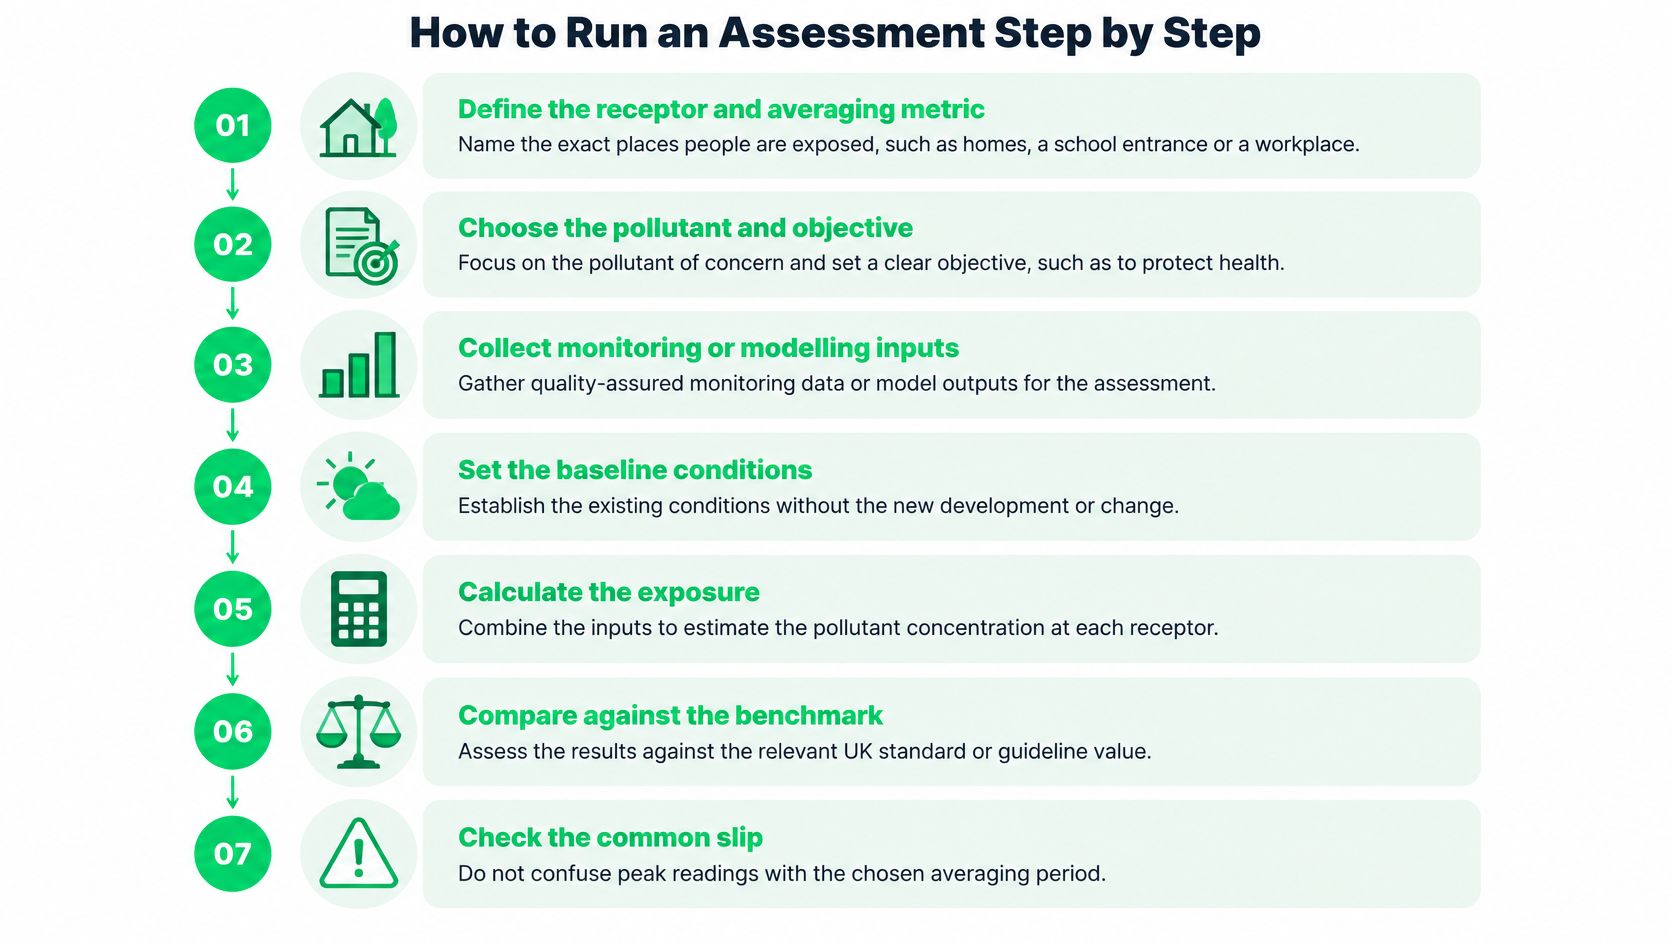
Build the evidence in a controlled sequence
Define the receptor and averaging metric. Mark the actual exposure locations on a plan: residential façades, a school entrance, an air intake or a workplace boundary. Establish which benchmark applies to each location and exposure duration. The common slip is treating the site boundary as the receptor without explaining why.
Obtain suitable monitoring records. The UK-AIR data archive contains records from more than 1,500 monitoring sites, alongside statistics and modelled background information. Select stations based on their suitability, not only their distance from the project. Record the dataset's status and download date so another reviewer can reproduce the selection.
Test completeness and representativeness. Check valid data capture, missing periods, site classification and relevant changes in the station's surroundings. Apply the acceptance requirements for the method and assessment purpose. Don't treat missing winter or operational periods as if they were randomly scattered gaps.
Compare measurements with background estimates. Select the appropriate mapped background, pollutant and assessment year. A difference between a monitor and a background grid estimate may be meaningful, but first check that you're comparing equivalent quantities. Background maps aren't measurements at a building entrance.
Examine the local roadside contribution. Use comparable roadside and background observations to investigate the additional local influence. Check period, method and geographical setting before subtracting concentrations. A difference between unrelated datasets can look precise while answering very little.
Investigate departures from the expected pattern. Align concentrations with traffic counts, combustion records, wind conditions and site activity logs. Examine instrument faults and maintenance records too. Don't remove an inconvenient peak until you've established whether it's invalid data or a real event.
Decide whether the evidence is sufficient. Record what remains uncertain and whether it could change the decision. Add site monitoring, modelling or both where that uncertainty matters. If you stop at screening, explain why a more detailed assessment wouldn't alter the outcome.
Before accepting the dataset: Check that its spatial coverage, time coverage and measurement quality all match the decision.
This sequence also helps control scope. Extra measurements should close an identified evidence gap, not merely increase the volume of information delivered.
Reading Results Against Baselines and Trends
Long-term improvement provides context, not clearance for an individual site. The national trend can fall while a particular entrance, façade or operating period still needs investigation.
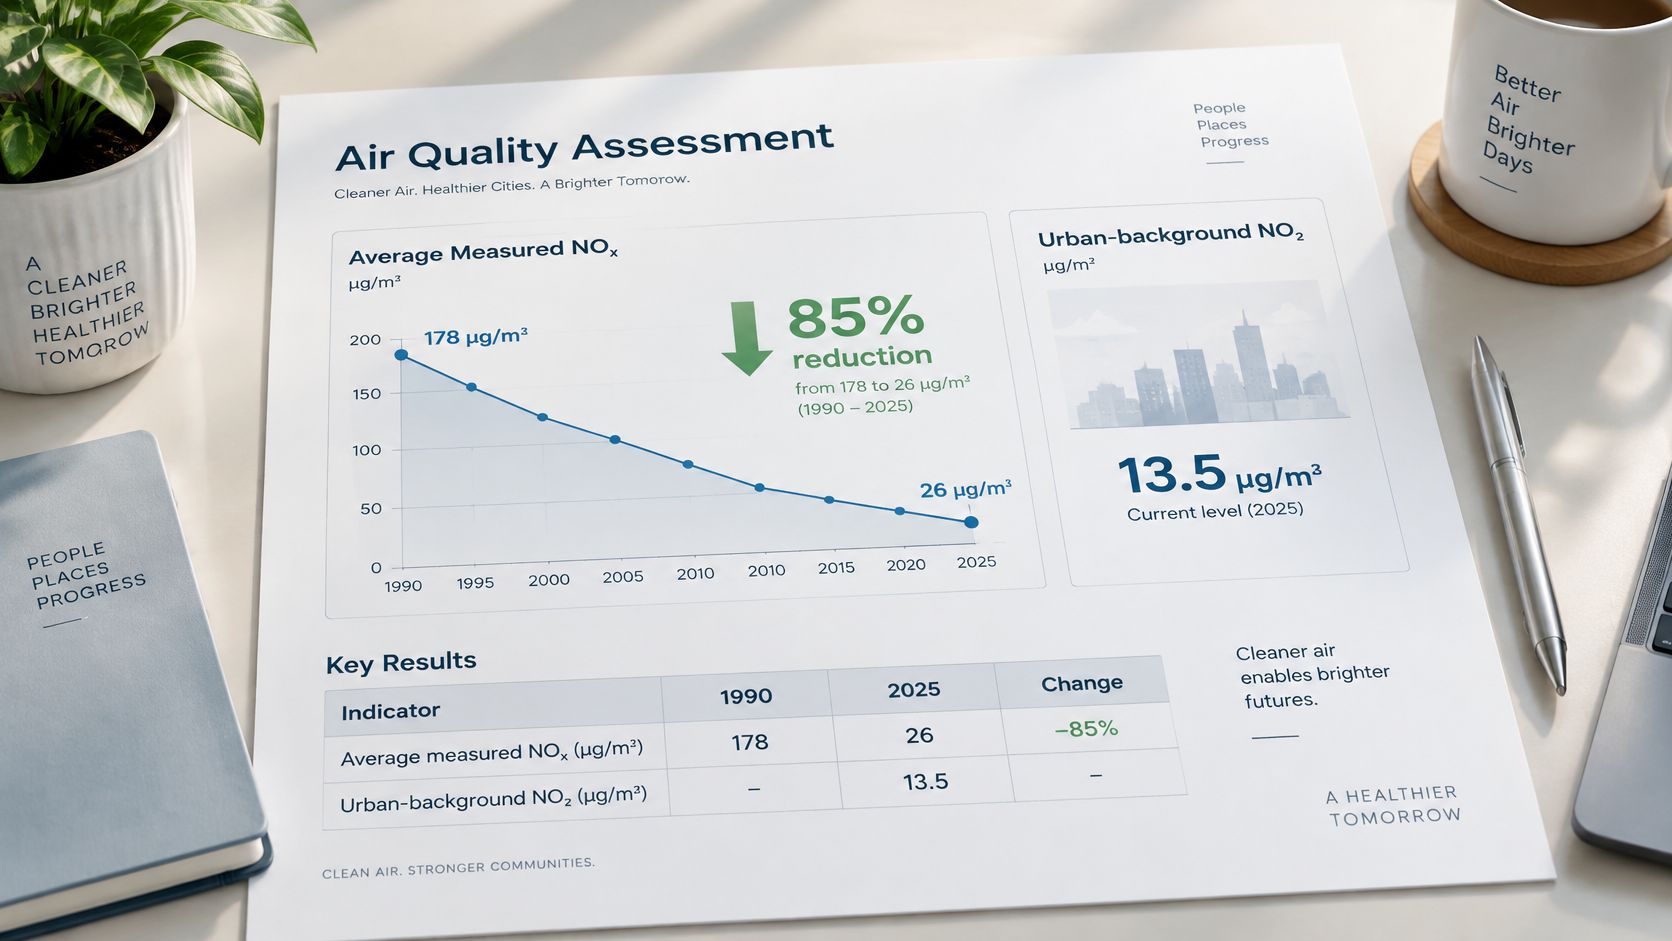
Defra's air quality statistics report average measured NOx falling from 178 µg/m³ in 1990 to 26 µg/m³ in 2025, with the same publication providing the urban-background and roadside NO2 trend indicators below.
Long-term air quality indicators
| Indicator | Period | Value |
|---|---|---|
| Average measured NOx | 1990 | 178 µg/m³ |
| Average measured NOx | 2025 | 26 µg/m³ |
| Urban-background NO2 annual mean | 2025 | 13.5 µg/m³ |
| Urban-background NO2 annual reduction | 1992 to 2002 | 2.7 µg/m³ a year |
| Urban-background NO2 annual reduction | 2006 to 2019 | 0.9 µg/m³ a year |
| Roadside NO2 annual reduction | 2006 to 2019 | 1.8 µg/m³ a year |
| Roadside PM10 annual mean | 1997 | 36.7 µg/m³ |
| Roadside PM10 annual mean | 2025 | 15.8 µg/m³ |
| AURN stations meeting PM2.5 data-quality requirements | 2025 | 130 |
For the particulate entries, Defra's PM10 compliance assessment reports roadside annual means of 36.7 µg/m³ in 1997 and 15.8 µg/m³ in 2025, while its PM2.5 compliance assessment identifies 130 qualifying AURN stations in 2025.
The NO2 indicators show why the chosen comparison period matters. Improvement wasn't uniform through time, and roadside and background locations didn't change at identical rates.
An assessment report should make those distinctions visible rather than compressing them into a single improvement claim.
Interpret the local uplift carefully
To investigate a roadside entrance, compare a representative roadside concentration with a suitable background concentration over the same period. Subtract the background from the roadside result to estimate the local uplift, then investigate what contributes to that difference.
That subtraction doesn't automatically isolate your project's emissions. Other roads, nearby combustion sources, monitoring uncertainty and mismatched locations may affect the result.
For trend analysis, keep a consistent baseline and flag changes in instruments, station locations or data processing. Otherwise, a break in the measurement series can resemble an environmental improvement.
Finally, supplement annual averages with the applicable short-term metrics. A national decline doesn't demonstrate that a particular receptor meets its benchmark, and an annual summary alone doesn't describe every relevant exposure episode.
Reporting Results Your Auditor Can Trace
A useful report lets another competent reader follow every result back to its origin. They should be able to identify the source record, understand the processing and see why the conclusion follows.
Traceability is more than attaching raw data. The report must also explain which records were accepted, which were excluded and how the assessment converted them into a decision.
The evidence trail to retain
- Receptor schedule and maps. Give each receptor a stable identifier, location, exposure description and reason for inclusion. Distinguish monitoring locations from the places you're assessing.
- Instrument identity and status. Record the model, reference or equivalence status, certification scope and calibration history. This establishes what evidence the device can support.
- Siting and sampling details. Include installation photographs, inlet position, nearby obstructions, exposure periods and operational interruptions.
- Data completeness. State the valid data capture percentage and the acceptance rule applied. Explain material gaps rather than hiding them in an appendix.
- Quality controls. Document calibration checks, maintenance, validation, corrections, rejected observations and relevant audit findings.
- Model records. Retain software versions, emissions inputs, meteorology, receptor coordinates, scenarios and verification decisions.
- Benchmark comparisons. Present the concentration, units, averaging period, applicable criterion and relevant uncertainty together.
- Accountable sign-off. Name the author, technical reviewer and person approving the conclusion, with their respective roles.
Keep conclusions within the evidence
State what the assessment cannot show. Examples include unmonitored hotspots, conditions during excluded operating periods or indoor exposure where only outdoor measurements were collected.
At ESG Consulting, every figure we produce traces back to source data, with the methodology, boundaries and assumptions documented for the client's auditor or assurance provider. That documentation allows reviewers to test the reasoning rather than accept a headline result.
The final conclusion should distinguish established findings from unresolved questions. Where further work is needed, name the missing evidence and explain which decision it could change.
Scope Your Assessment Before Work Starts
Agree the scope before ordering instruments or booking modelling work. A short, explicit commissioning brief gives the project lead a stronger basis for managing cost, technical quality and review.
The first decision is what the assessment must enable someone to approve, reject or change. Equipment selection comes afterwards.
Resolve the commissioning checks
- Identify the pollutants. Describe the source or development and select pollutants that could materially affect the decision. Commission a completed threshold register rather than relying on a general pollutant list.
- Confirm the receptors. Agree the homes, schools, workplaces and other relevant exposure locations. Decide explicitly whether occupied indoor spaces are included.
- Establish the trigger. Name the planning requirement, permit provision or reporting obligation. Record the decision-maker's expectations for evidence and review.
- Agree the method and coverage. Set the scenarios, monitoring locations, operating conditions and seasonal coverage required. Include a rule for responding if the initial evidence is incomplete.
Indoor work needs a separate scope, not an extra dashboard tile. The Institution of Environmental Sciences' air pollution inquiry submission.pdf) highlights the assessment gap: CO2 can indicate ventilation conditions, but it doesn't measure particulate matter, NO2, volatile organic compounds, mould or ultrafine particles.
For a healthcare building, that means identifying relevant occupied rooms, outdoor air entry points and building activities before selecting pollutants. Any proposed ventilation or filtration response should address the identified source and exposure, not just improve a sensor display.
Specify what the team will receive
Require receptor-by-receptor findings, a documented data trail and a clear limitations statement. Add an action schedule that identifies the decision owner, proposed response and evidence needed to confirm completion.
Our projects are backed by ESG Consulting's in-house sustainability and quality assurance teams. For the project lead, the immediate next step is to approve a written scope that connects each assessment question to a method, an evidence standard and a named output.
ESG Consulting offers ESG assessment and environmental reporting support with documented methodologies and traceable evidence. Visit ESG Consulting to discuss how your air quality assessment evidence should fit into wider sustainability reporting, including its boundaries, assumptions and sign-off requirements.