Scope 1 emissions, SECR reporting, carbon inventory, UK SRS, fugitive emissions
Scope 1 Emissions: Measure, Report and Cut
By ESG Consulting Team · · 14 min read
Scope 1 emissions are greenhouse gases released directly from sources an organisation owns or controls, such as boilers, fleet vehicles and refrigerant leaks. Purchased electricity from the grid is generally reported as Scope 2, not Scope 1.
A facilities manager might be checking gas use in the plant room while the fleet team reviews fuel-card records and a contractor tops up an air-conditioning unit. Each activity raises the same practical question: does the organisation control the source, and is the evidence recorded well enough to support the inventory?
That distinction matters to the board as well as the ESG team. By the end of this guide, you'll be able to identify likely sources, assess whether a reported fall represents a physical reduction or an accounting shift, and understand which reporting obligations may apply. UK national emissions totals provide context, but they use different boundaries from a corporate inventory, so allocating a share of a national figure won't produce your organisation's Scope 1 total.
Table of Contents
- What Scope 1 Emissions Actually Cover
- Where Scope 1 Emissions Come From
- Who Controls the Emission Source
- How to Calculate Scope 1 Emissions
- Scope 1 Duties under SECR UK SRS and CSRD
- When a Scope 1 Fall Is Not a Real Cut
- How to Choose Scope 1 Support
What Scope 1 Emissions Actually Cover
Consider a UK site with gas boilers, diesel vans, a backup generator and air-conditioning equipment. The boilers and generator release greenhouse gases when fuel is burned. The vans do so when their engines use fuel. A refrigerant leak can release gases without any visible smoke, and it may go unnoticed if facilities records capture only the contractor's maintenance visit.
The key test is whether emissions come directly from a source the organisation owns or controls. That makes Scope 1 an operational boundary, not merely a list of things found on a company's premises. Grid electricity illustrates the distinction: the organisation uses the electricity, but the emissions from generating purchased power are generally reported as Scope 2.
A smokestack-versus-plug analogy can help. Fuel burned in a boiler or company vehicle is like a smokestack: the organisation's controlled equipment releases emissions directly. Electricity coming through a plug is generally Scope 2, even if the organisation controls the building where it's used. The analogy is a starting point, not a substitute for checking who operates and controls each asset.
Why the boundary matters
The same physical site can contain sources that fall into different inventories. A landlord may control a central boiler, while a tenant runs its own backup generator. A business could own a vehicle used by a contractor, or lease a vehicle while retaining day-to-day operational control. Those arrangements need a consistent, documented decision rather than an assumption based on the address, invoice or logo on the vehicle.
National figures can't be used to fill that gap. UK territorial accounts count emissions released within UK borders, while residence-based accounts follow emissions associated with UK residents and UK-registered businesses. Neither is a corporate inventory of assets under one organisation's control.
The useful outcome is practical: name the sources, identify who controls them, and retain activity records. That lets the board distinguish a defensible inventory from an estimate based on broad sector figures, and gives the ESG team a sound basis for calculation and reporting.
Where Scope 1 Emissions Come From
A facilities walkdown at a distribution site turns up three sources that never appeared on an energy bill: a diesel generator tested monthly, a gas-fired space heater in the dispatch bay, and refrigerant top-ups recorded only in the air-conditioning contractor's service log. None of them raised a fuel invoice in the site's own accounts. All three belong in the Scope 1 inventory if the organisation controls them.
A source list works like a fixed-asset register. Every entry needs a physical location, a named owner or operator, and records that prove activity happened. Walk the site first, then reconcile what you find against fleet, facilities, maintenance and production records. A finance-led review of energy bills alone will miss the generator and the refrigerant in the example above.
- Stationary combustion: boilers, furnaces, generators and industrial combustion equipment that burn fuel at a fixed location. Gather fuel and meter records, and identify which equipment uses each fuel.
- Mobile combustion: cars, vans, lorries and other vehicles where the organisation owns or controls them. Check owned and leased fleets against fuel-card and vehicle records.
- Process emissions: greenhouse gases released through chemical or physical transformations during production. Production and process teams can help identify them.
- Fugitive emissions: refrigerants leaking from refrigeration and air-conditioning systems. Look for service records, leak reports and top-up logs, including records held by contractors.
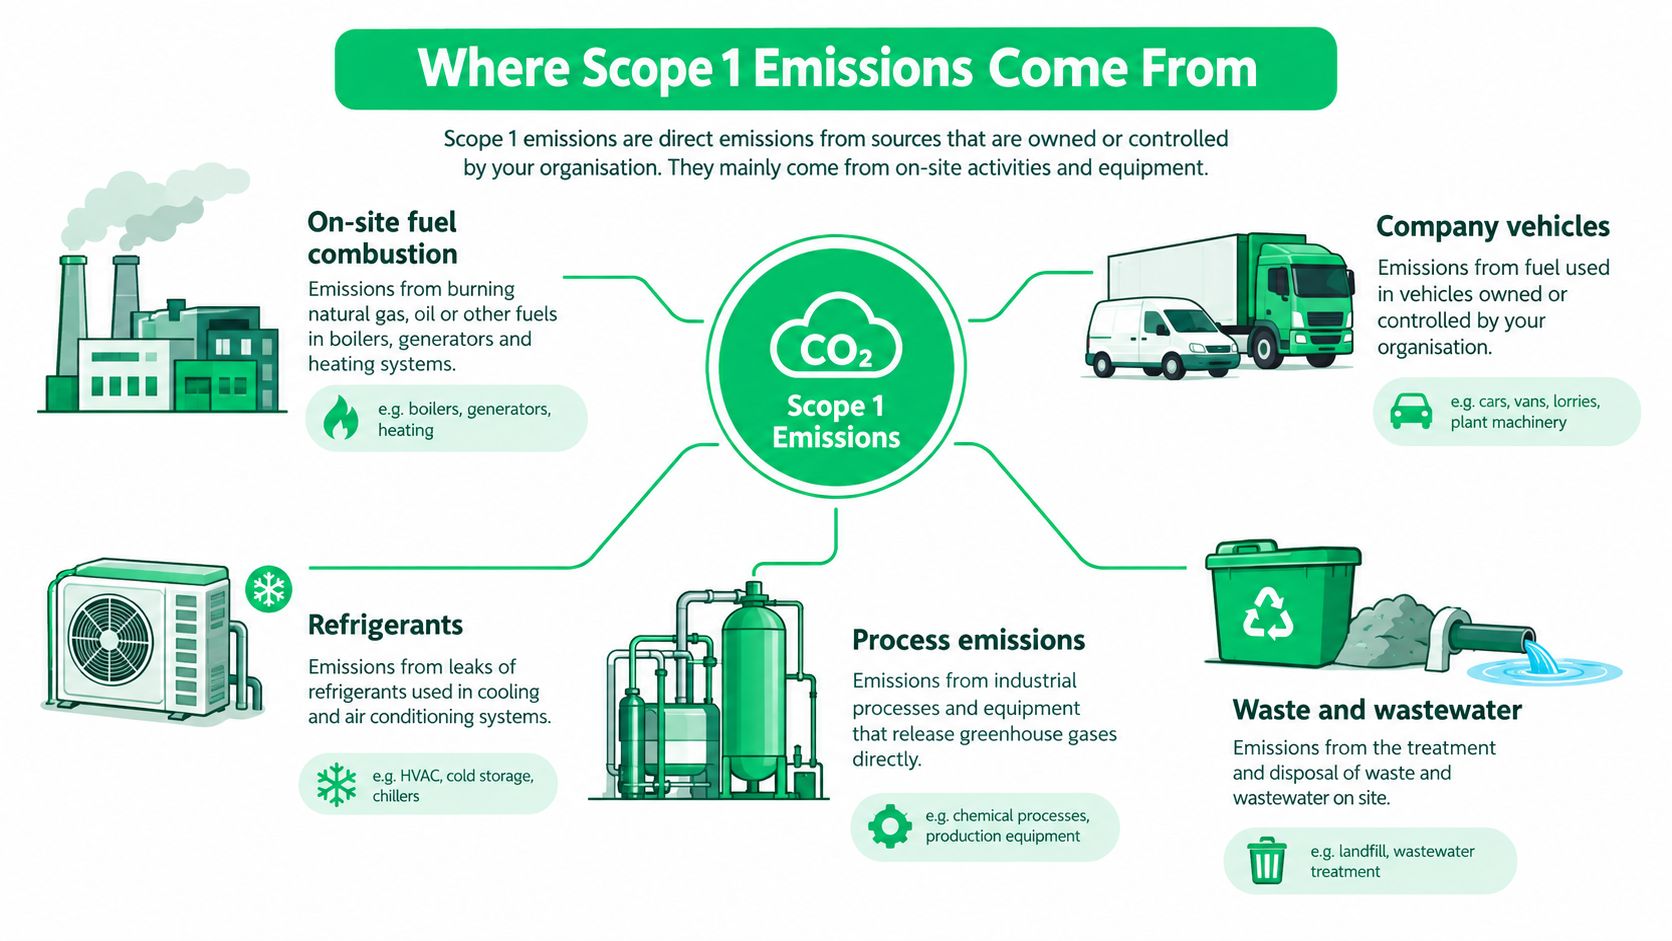
UK public-sector sustainability reporting guidance requires public bodies to report domestic Scope 1 emissions and recommends breaking them down by source, such as boilers, fugitive emissions and fleet vehicles. The UK sustainability reporting guidance shows what that breakdown looks like in practice. The same approach serves private organisations: a source-level split reveals which activities drive the total and which records need attention.
Evidence sits at source level
Each source category produces its own trail of proof. Stationary combustion leaves meter readings and fuel deliveries. Vehicles leave fuel-card transactions and mileage logs. Refrigeration leaves service reports and refrigerant weights added per top-up. These physical indicators matter twice over: they make each inventory entry defensible, and they later provide the test for whether a fall in the total reflects genuine abatement or a change in what the organisation counts.
Practical rule: every source on the list needs an owner, an activity record and an emissions factor. If you cannot point to all three, treat the entry as unverified until you can.
A short video can help teams visualise common direct sources before they check their own site and fleet records.
Who Controls the Emission Source
The hard question isn't only what emits. It's who controls the source, and has the organisation applied that test consistently? A Scope 1 inventory can misrepresent actual control when leased assets, shared sites, subsidiaries or outsourced operations are included or excluded without a written rule.
Take a leased van. If the company directs its use and operates it as part of its fleet, the inventory decision shouldn't rest on the word “leased” alone. For a landlord-controlled boiler, the tenant needs to establish who operates the system and how the reporting boundary treats the arrangement. At a shared site, each party should document responsibility for equipment and activity data instead of assuming the other party has counted it.
A subsidiary overseas also requires a clear group boundary. National accounting won't settle the corporate question. Territorial emissions count releases inside UK borders, while residence-based accounts are the closest national measure of direct emissions associated with UK residents and UK-registered businesses, including activity outside the UK. In 2023, residence-based emissions were estimated at 479 MtCO2e, the lowest in the available series beginning in 1990 and 43.0% below the 1990 figure. The Office for National Statistics explains the different measurement bases.
Document decisions that change the total
In the same residence-based account, the energy industry produced approximately 74 MtCO2e, transport 73 MtCO2e and manufacturing 71 MtCO2e in 2023. Electricity generated from natural gas represented 45.9% of energy-industry emissions. Those national figures provide background only. They don't tell a company which sources it controls or what belongs in its inventory.
Fugitive emissions deserve particular attention. A small refrigerant leak may be more decision-relevant than a well-metered boiler because refrigerants can have high global-warming potential and leakage can be missing from purchasing or facilities records. The UK national inventory covers seven gases, including methane, nitrous oxide and fluorinated gases, rather than carbon dioxide alone. That's a reminder not to build a combustion-only inventory.
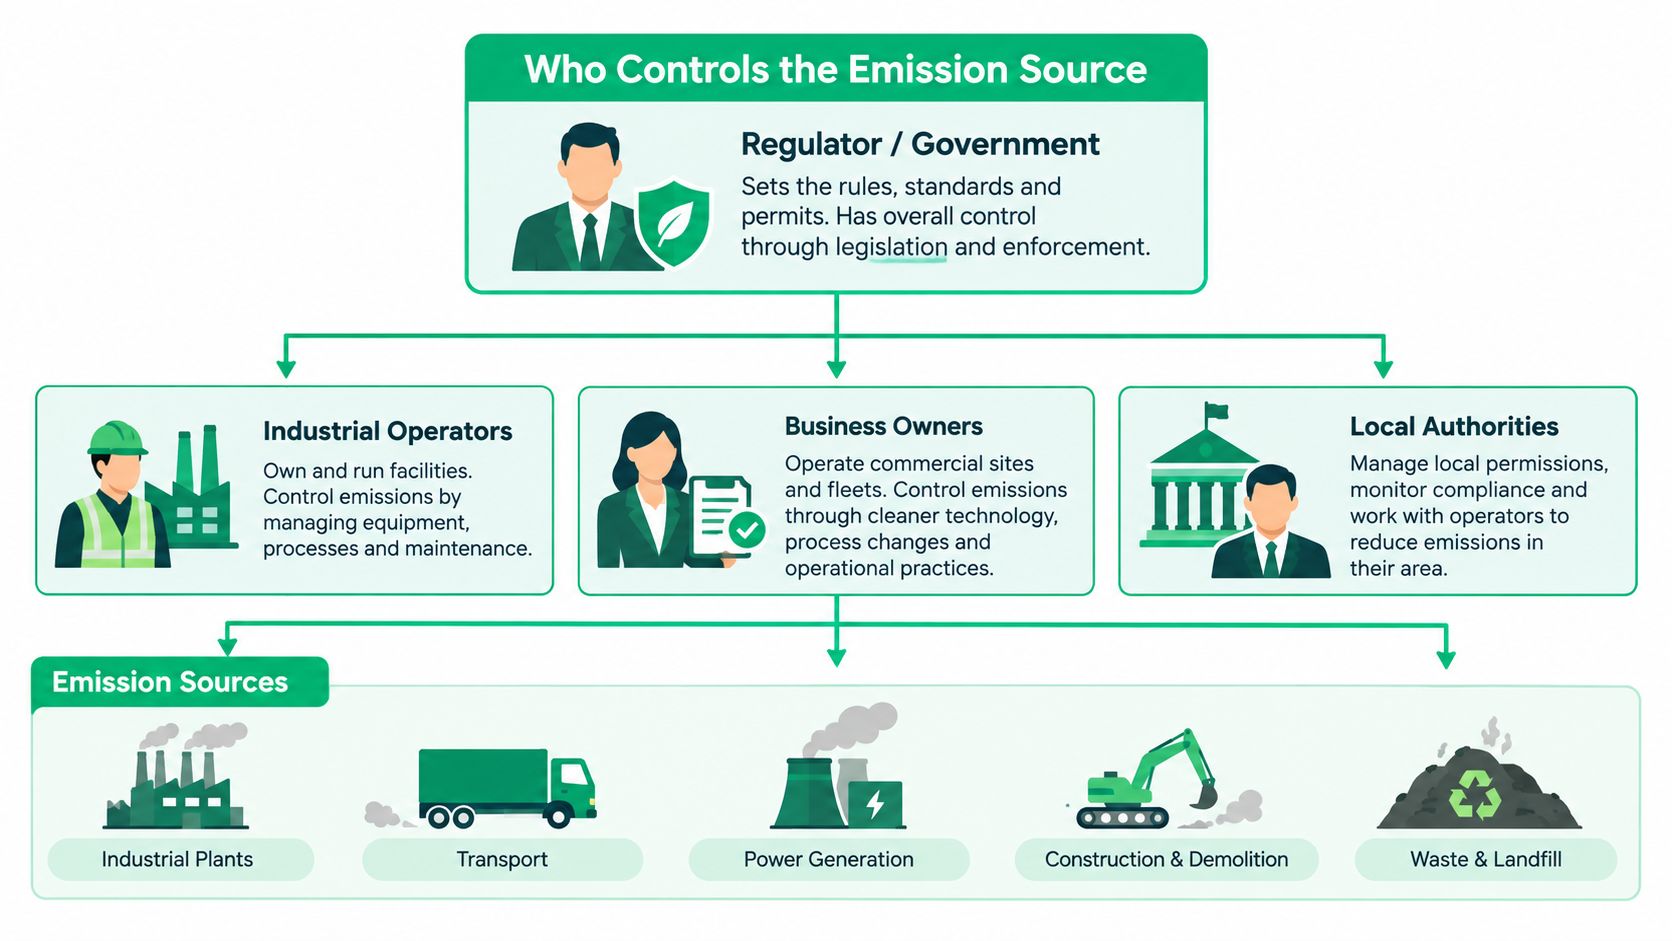
Record the chosen control test and apply it consistently year to year. Keep the basis for including or excluding leased vehicles, landlord equipment, shared sites, subsidiaries and outsourced operations. If the decision changes, explain what changed and whether the inventory needs a like-for-like comparison.
How to Calculate Scope 1 Emissions
A Scope 1 total is only as credible as the records behind it. Treat the calculation like a bank reconciliation: every reported tonne should trace to a controlled source, a measured activity and a factor chosen for that reporting year.
Start with a source register, not a spreadsheet total. List each boiler, furnace, generator, owned or leased vehicle, process line and refrigerant system inside the documented boundary, then name the evidence that proves control: an asset schedule, a lease, a fuel-card account, a meter serial number or a maintenance contract. That register catches two common errors: counting a landlord's asset because it sits on site, and missing an outsourced forklift because the invoices sit with a contractor.
For each source, capture activity data in the physical unit the factor expects: kWh or litres for stationary fuels, litres or distance for fleet where that basis is used, and kilograms added or recovered for refrigerants. Multiply by the current UK government conversion-factor set for the same gas, fuel and reporting basis, keeping Scope 1 separate from purchased electricity. A gas boiler line should read as metered gas consumption multiplied by the applicable natural-gas factor. A refrigerant line should read as mass topped up during servicing, adjusted for recovered gas where records exist, then treated for that refrigerant's warming potency.
Check the result against physical signals before sign-off. Lower metered gas, fewer fuel-card litres, reduced refrigerant top-up, closed leak repairs and stable runtime hours point toward real abatement. A fall that follows a sale, closure or outsourcing needs labelling as a boundary movement, with like-for-like workings kept alongside the headline total.
Keep the evidence with the calculation
Build the file so a reviewer can walk the chain in both directions: from reported total to calculation, from calculation to activity data, and from activity data to source record. Keep together:
- Energy records: Meter readings and supplier invoices for gas and other fuels.
- Fleet records: Fuel-card extracts, plus ownership and lease schedules showing which vehicles sit inside the boundary.
- Refrigerant records: Contractor service sheets, leak reports and refrigerant top-up logs.
- Boundary record: The organisational boundary and decisions on shared, leased or outsourced assets.
- Calculation record: Activity data, selected factor, unit conversion and result, stored as one workings pack.
A missing refrigerant log can leave a high-impact source outside the total. A total that cannot be traced to a meter, fuel record or service entry is hard to verify.
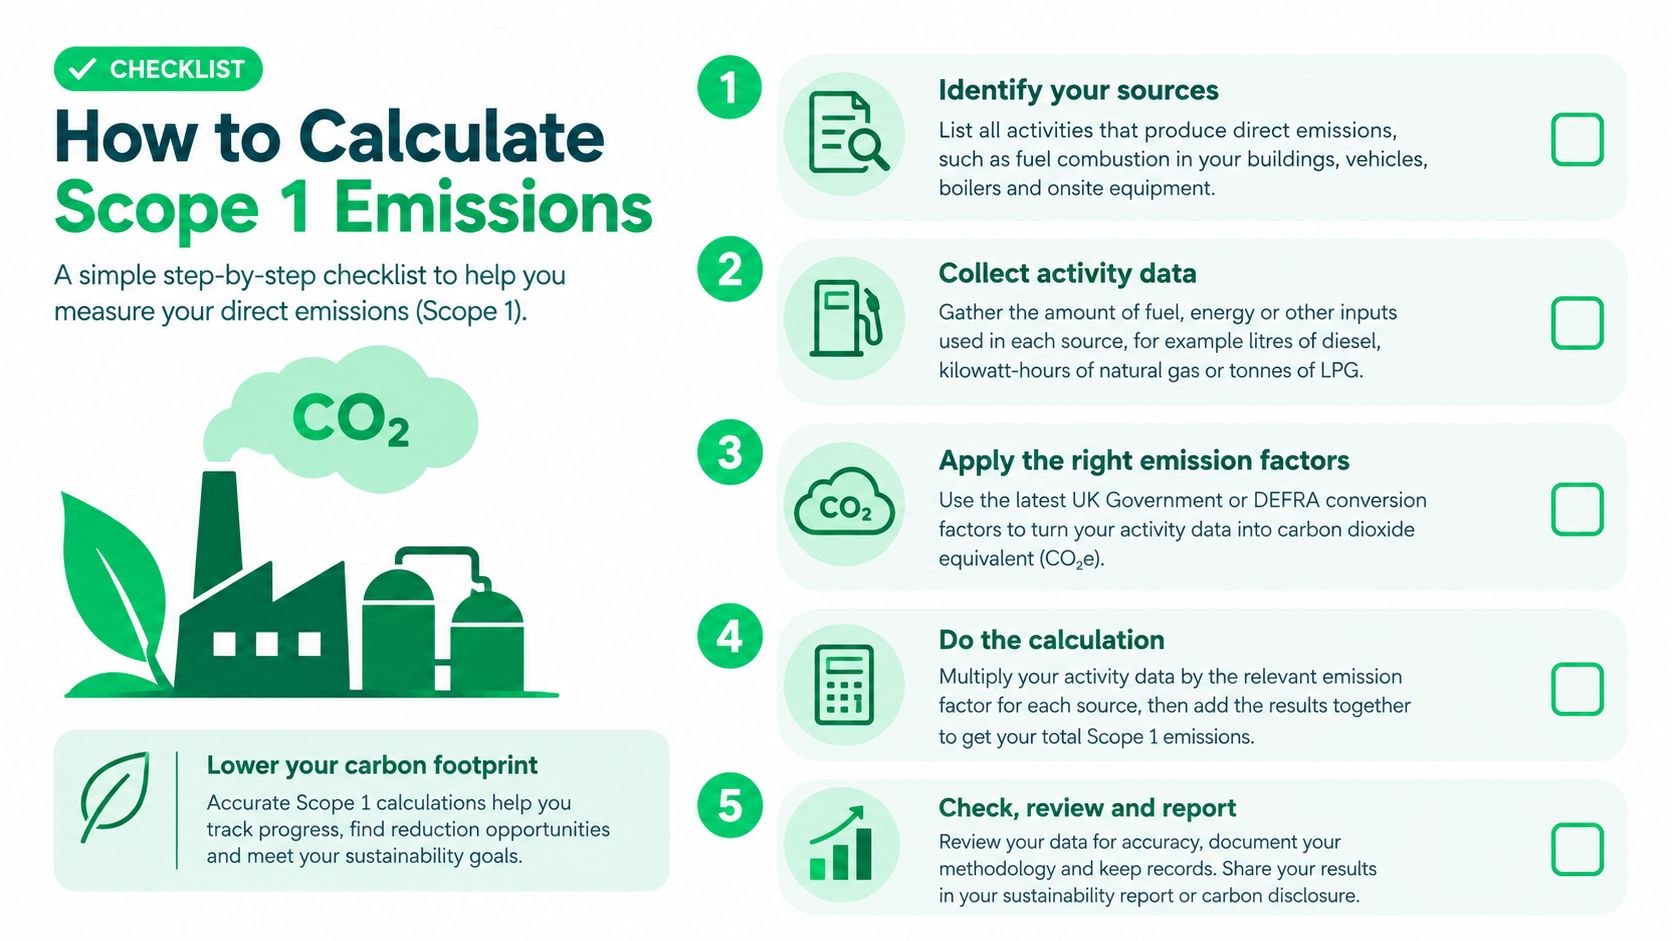
Evidence test: A reviewer should be able to move from reported emissions to the calculation, from the calculation to activity data, and from the activity data to a record. If one link is missing, investigate before sign-off.
Scope 1 Duties under SECR UK SRS and CSRD
A sound inventory can support different disclosures, but the applicable rules depend on the organisation. Some UK companies report their energy use and carbon emissions under SECR requirements; public-sector bodies may follow government sustainability reporting guidance; other organisations may need to prepare for UK Sustainability Reporting Standards (UK SRS) or report under the Corporate Sustainability Reporting Directive (CSRD) and European Sustainability Reporting Standards (ESRS) if they're in scope.
The same underlying figures may feed an annual-report narrative, intensity ratios, climate-related financial disclosures or a later assurance file. But a reporting framework's applicability needs checking before teams decide how much evidence and narrative to prepare. Good advice identifies obligations that apply and those that don't. A company with a limited reporting requirement shouldn't assume it needs a file designed for every framework, while an organisation that is in scope shouldn't overlook a duty.
Compare the reporting purpose
| Regime | Scope 1 expectation | Evidence that usually supports it |
|---|---|---|
| SECR | In-scope UK companies report energy and carbon information, with Scope 1 and related disclosures as applicable to their circumstances. | Fuel and energy records, calculation workings, intensity-ratio data and annual-report narrative support. |
| Public-sector sustainability reporting | Guidance requires domestic Scope 1 reporting and recommends disaggregation by source. | Source-level activity data for boilers, fleet, fugitive emissions and other relevant sources. |
| UK SRS S1 and S2 | Organisations should assess whether the standards apply and prepare relevant sustainability and climate disclosures where required. | Traceable inventory data, governance information and supporting disclosure records. |
| CSRD and ESRS | Groups actually in scope assess and report under the applicable requirements, including relevant emissions information. | Group-boundary records, source data and evidence supporting the reported disclosures. |
The table is a practical comparison, not a determination of legal applicability for any individual organisation. A reporting team should confirm the rules that apply to its entity and group structure before finalising the disclosure.
Keep related schemes distinct. ESOS is an energy-audit scheme, not a Scope 1 inventory. Scope 3 supplier analysis is also separate from the direct-emissions calculation described here. A compliant total can still mislead if the narrative presents an accounting change as climate progress, so any reported reduction needs a separate performance check.
When a Scope 1 Fall Is Not a Real Cut
A lower Scope 1 figure can reflect genuine abatement, a fuel switch, electrification, outsourcing or a revised reporting boundary. Each outcome means something different for the business. Before accepting a fall as progress, a board should ask two questions: what happened to the physical activity, and where did the emissions go?
Take a factory that replaces a gas boiler with a heat pump. Gas combustion and its Scope 1 emissions should fall, while purchased electricity use may rise in Scope 2. The switch can still be a worthwhile operational change, yet the Scope 1 line by itself shows only part of the effect. Track gas use, electricity use and useful heat output so the organisation can explain what changed.
An electric van fleet presents a similar distinction. Fuel combustion at controlled vehicles should decline, while charging electricity generally sits in Scope 2. If the fleet moves to a logistics contractor instead, the company may report less direct fuel use because it no longer controls the vehicles. That is an outsourcing and boundary change, and the associated emissions now sit in the contractor's inventory. Record the service change and assess the relevant emissions elsewhere in the value chain.
Test the physical activity
A falling total shows that something changed. It says nothing yet about why.
Sector-wide fuel switching, milder winters or weaker output across the economy can push emissions down at the same time as a company's own efforts. The source-level record has to carry the proof, so ask what the meter readings, fuel invoices and refrigerant logs show for each asset, and whether the same assets sat inside the boundary in both periods.
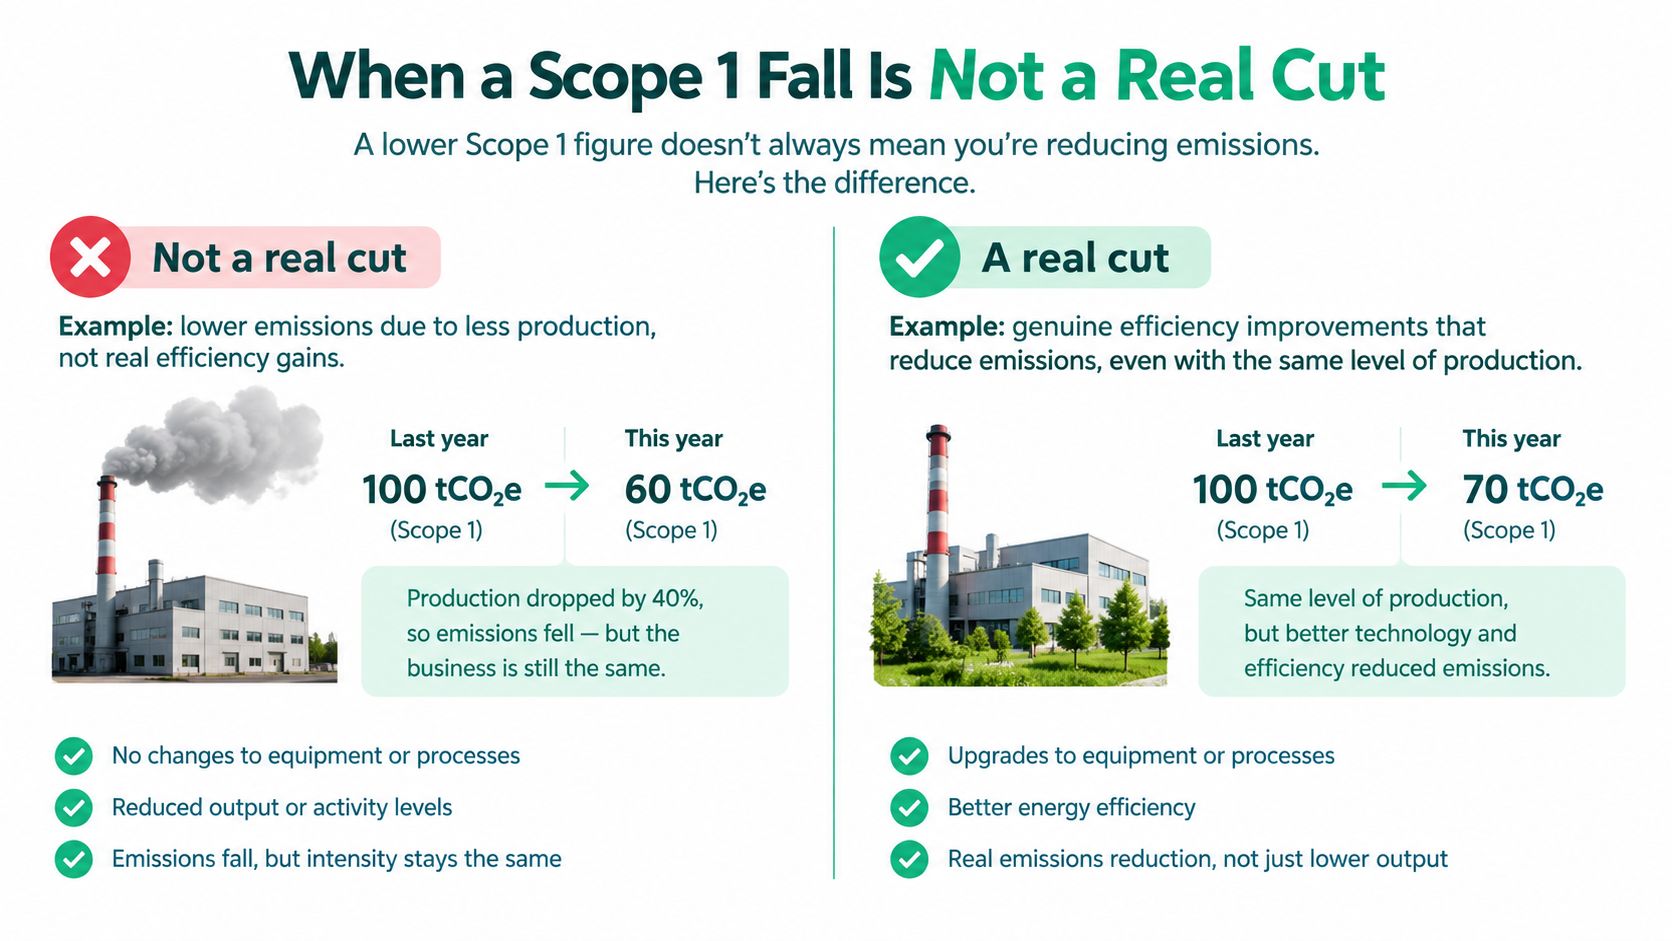
For a claimed reduction, compare physical indicators over a consistent boundary. Useful checks include gas kWh, litres of fuel, refrigerant kilograms and useful output. If production falls, emissions may fall because less activity took place; an intensity measure or output context can help distinguish that from improved performance. If the organisation acquires a business, outsources heating or changes which assets it controls, consider a like-for-like restatement and explain the adjustment.
Grid decarbonisation can reduce emissions associated with purchased electricity. It leaves the Scope 1 figure untouched. A refrigerant-leak prevention programme may deliver more decision-relevant progress than a small boiler adjustment, particularly where earlier records missed top-ups or leaks. Ask for the physical evidence behind each claim before it enters the board pack.
How to Choose Scope 1 Support
Organisations can build an inventory in-house, use a generic calculator, or ask a specialist to develop the boundary, evidence file and disclosure narrative together. The right choice depends on whether the team can resolve control questions, obtain fleet and refrigerant records, explain changes after outsourcing and maintain a file that can withstand assurance.
A generic calculator may help with arithmetic, but it won't necessarily establish who controls a shared boiler or whether a leased vehicle belongs in the reporting boundary. An in-house team may have the operational knowledge to settle those questions, provided it can document the decisions and retain source evidence. A specialist can add value where those tasks need to be coordinated with reporting obligations and reduction claims.
ESG Consulting is a London-based UK ESG consultancy that supports SECR Scope 1 and Scope 2 inventories, intensity ratios and annual-report narratives, and assesses UK SRS S1/S2 and CSRD applicability. Its work can also connect inventory findings with costed abatement pathways. For a buyer, practical delivery questions include whether one named account lead will carry the work from scoping to sign-off, whether the fee and scope are fixed, and whether every disclosure can be traced to source data. Details of its carbon reporting and sustainability disclosure support include advice on when a reporting obligation doesn't apply.
This month, list the organisation's owned and leased combustion sources, fleet and refrigerant top-ups. Mark each source as inside or outside operational control, then take unresolved cases to a scoping conversation before the reporting cycle locks in a weak boundary.
ESG Consulting helps UK organisations build traceable Scope 1 and Scope 2 inventories, assess applicable reporting duties and connect reported emissions with practical reduction pathways. If your team needs support resolving its control boundary or preparing disclosures, visit ESG Consulting to discuss the inventory before sign-off.