scope 2 emissions, location-based method, market-based method, SECR reporting, UK conversion factors
How Scope 2 Emissions Are Calculated in the UK
By ESG Consulting Team · · 13 min read
The UK Government's 2025 electricity conversion factor fell by approximately 15% from 2024, mainly because of lower natural-gas generation and increased net electricity imports. That change can reduce an organisation's reported Scope 2 total even if its electricity use stays exactly the same, so a lower figure isn't automatically proof of operational progress. The UK Government's 2025 greenhouse-gas conversion factors show why carbon reporting needs to make both the electricity consumed and the factor used visible.
For UK organisations, a reliable Scope 2 calculation starts with the energy crossing the site boundary, then applies the right emissions factor and preserves the evidence behind the result. The challenge isn't just producing a number. It's explaining what changed when that number goes up or down.
Table of Contents
- What Scope 2 Emissions Include
- Location-Based and Market-Based Results Compared
- How to Turn Purchased kWh into Tonnes
- How Much of a Scope 2 Drop Is Real
- Where UK and Voluntary Rules Ask for Scope 2
- Evidence and Publication Test
What Scope 2 Emissions Include
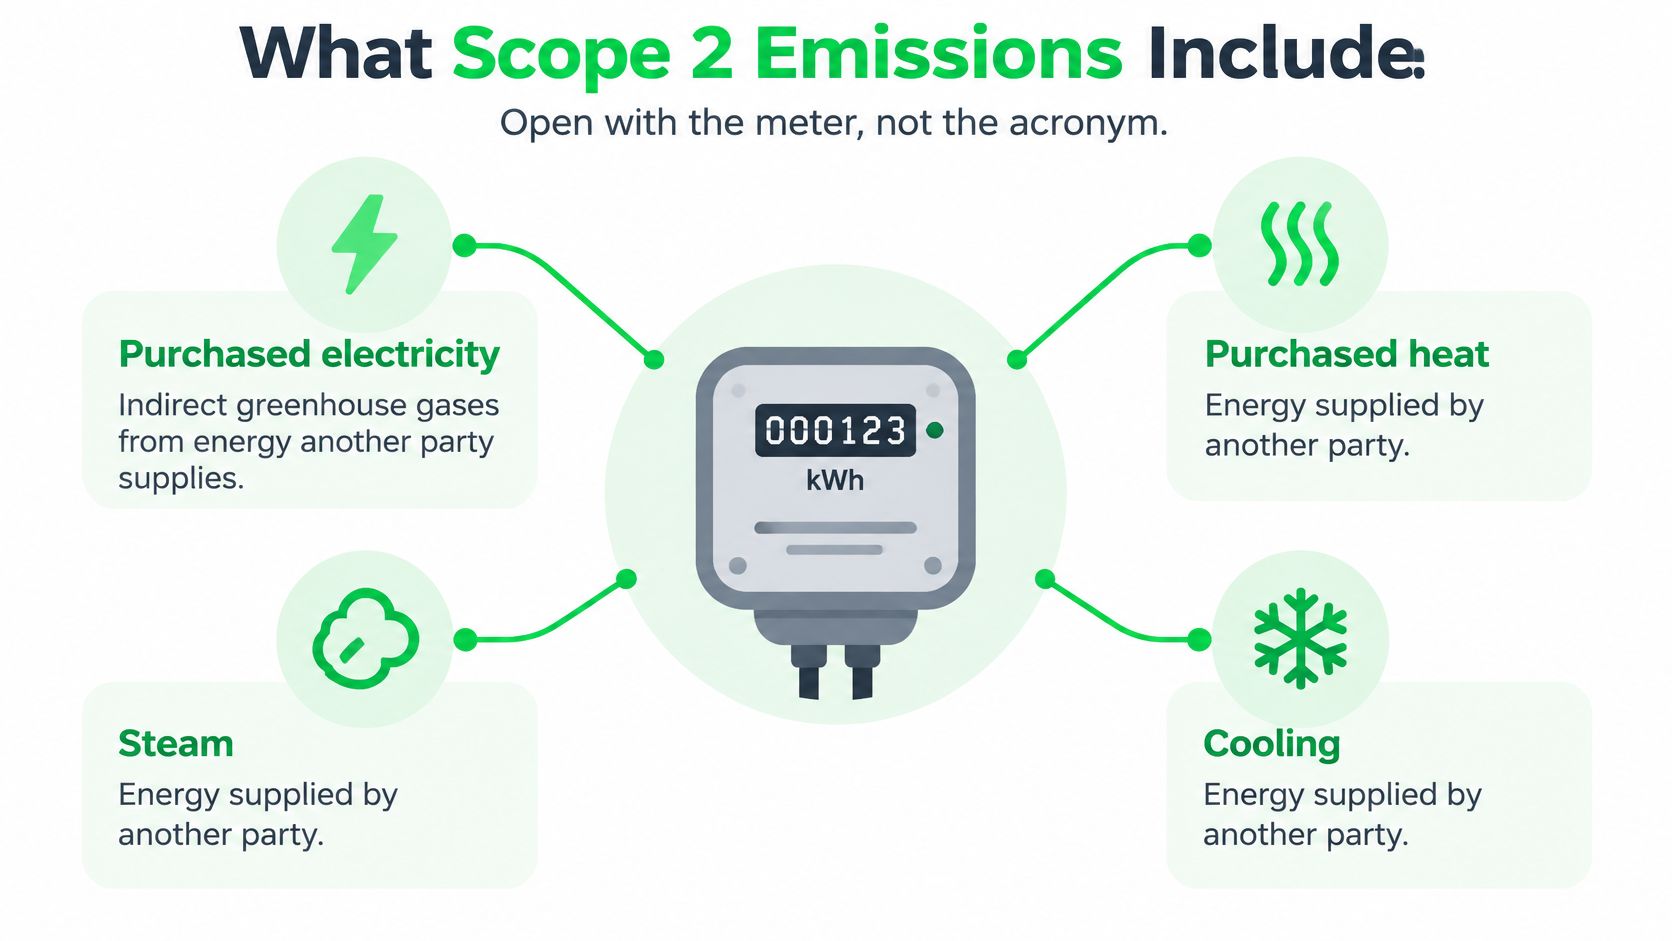
Start with the meter at a typical office, factory or hospital site. It records electricity supplied from outside the organisation. That electricity generates Scope 2 emissions: indirect greenhouse-gas emissions released when another party produces energy that the organisation consumes.
The same boundary can include purchased heat, steam and cooling. For example, a site connected to a district heating network should consider the heat it buys, not just its electricity. The emissions occur where the energy is generated, rather than at the site, but the organisation accounts for them because its consumption creates demand for that energy. UK Government sustainability reporting guidance recommends recording the related energy use in kilowatt-hours and reporting gross Scope 2 emissions.
Follow the energy across the boundary
The distinction from Scope 1 is about where the fuel is burned. If the organisation burns gas in its own boiler, that combustion is generally Scope 1. Fuel burned in company-owned vehicles is also generally Scope 1. Electricity produced at a power station and supplied through the grid is Scope 2 for the organisation that buys it.
That boundary helps prevent both omissions and double counting. A site shouldn't classify grid electricity as Scope 1 just because electricity powers equipment on its premises. Nor should it include a landlord's energy supply without checking which party controls the supply and how the reporting boundary treats it.
Keep the activity data visible
Utility bills give a useful starting point, but the carbon calculation needs energy quantities, not just expenditure. Retain invoices and meter records showing kWh, identify the relevant sites and reporting period, and connect each energy type to its emissions calculation. Split Scope 2 by electricity, heat, steam or cooling when doing so makes the inventory easier to understand.
For organisations preparing SECR disclosures, purchased-energy figures require auditable consumption records and the applicable UK emissions factors. That makes Scope 2 a reporting and governance matter, not just a sustainability metric.
The result can be presented in two ways for grid electricity: a location-based view and, where the reporting framework allows, a market-based view. The calculation then turns the recorded kilowatt-hours into tonnes.
Location-Based and Market-Based Results Compared
| View | What it measures | Factor or instrument | Green tariff effect | Typical UK use |
|---|---|---|---|---|
| Location-based | Average emissions of grid electricity the site consumes | UK grid-average factor for electricity supplied, for the reporting year | Doesn't remove or reduce the location-based total | SECR and like-for-like UK comparisons |
| Market-based | Emissions from the contractual electricity the organisation claims | Supplier-specific factors, renewable contracts or energy attribute certificates that meet the applicable quality rules | Can lower this line if the instruments qualify | GHG Protocol dual reporting and many voluntary disclosures |
| Transmission and distribution | Losses between generation and the meter, tied to the same kWh | Separate UK T&D factor, not the generation factor | Doesn't change the measured losses | Reported separately, often outside Scope 2 with Scope 3 |
The table separates three different questions. Location-based reporting asks about the average emissions associated with the grid electricity consumed. Market-based reporting reflects qualifying contractual arrangements for electricity procurement. Transmission and distribution, or T&D, represents losses between generation and the meter and uses a separate factor.
A green tariff may change the market-based result. It doesn't change the site's kWh or erase the location-based result.
That distinction matters because a renewable tariff doesn't, by itself, change the average mix of electricity transmitted through the national grid. UK guidance applies the grid-average factor to grid electricity, including electricity bought under a green tariff. The UK Government's final greenhouse-gas statistics for 1990 to 2024 explain the consumer-side accounting perspective: emissions associated with electricity are attributed to end users through their consumption, even though generation takes place elsewhere.
Show both electricity results clearly
Suppose a business consumes 10,000,000 kWh. At the 2025 UK location-based generation factor, it reports 1,770 tCO2e for generation. If it also has a contractual instrument with a qualifying supplier-specific factor, it can calculate a market-based result using the factor documented in that contract or certificate evidence. Without that documented factor, don't invent a second number. Keep the kWh the same and show the market-based result only when the supporting evidence and reporting framework justify it.
Treat T&D as another distinct line, calculated with its own factor. Don't add it to the electricity-generation figure; state clearly how the inventory presents it. Retain both location-based and any market-based result so readers can see the physical-grid calculation alongside the procurement claim.
How to Turn Purchased kWh into Tonnes
For 10,000,000 kWh of electricity, the UK Government's 2025 factor for electricity supplied to the grid produces 1,770 tCO2e for generation. The calculation is:
10,000,000 kWh × 0.177 kgCO2e/kWh ÷ 1,000 = 1,770 tCO2e
The separate T&D calculation is 10,000,000 × 0.01853 ÷ 1,000 = approximately 185 tCO2e. It belongs on its own line, rather than being folded into the generation total. These are the UK Government's 2025 factors for electricity supplied to the grid and for transmission and distribution, respectively. The 2025 UK Government conversion-factor set identifies the factors and the generation result for this level of consumption.
| Component | Consumption | 2025 factor | Result | Where it is reported |
|---|---|---|---|---|
| Electricity generation | 10,000,000 kWh | 0.177 kgCO2e/kWh | 1,770 tCO2e | Location-based Scope 2 |
| Transmission and distribution | 10,000,000 kWh | 0.01853 kgCO2e/kWh | Approximately 185 tCO2e | Separate line, often with Scope 3 |
Apply the calculation consistently
Collect the electricity kWh. Use meter data and supplier invoices covering the reporting year. Keep the period clear so the electricity total matches the inventory boundary.
Separate on-site fuel. Fuel burned in the organisation's own boiler or vehicles generally belongs in Scope 1, not in the purchased-electricity calculation.
Calculate generation emissions. Multiply the purchased electricity kWh by the relevant UK generation factor for the reporting year. Divide the result in kilograms by 1,000 to convert it to tonnes.
Calculate T&D separately. Apply the T&D factor to the relevant electricity consumption and disclose the result separately where required by the reporting approach.
Record the method. Show the kWh, the factor and the factor's publication year alongside the result. Heat, steam and cooling need their own relevant factors, not the electricity factor.
A factor is not a measure of how efficiently a site uses electricity. The 2025 electricity factor fell by approximately 15% from 2024, mainly because of lower natural-gas generation and increased net electricity imports. So the same building can report fewer tonnes without reducing its kWh. Before describing a year-on-year fall as an efficiency gain, separate changes in electricity use from changes in the factor.
How Much of a Scope 2 Drop Is Real
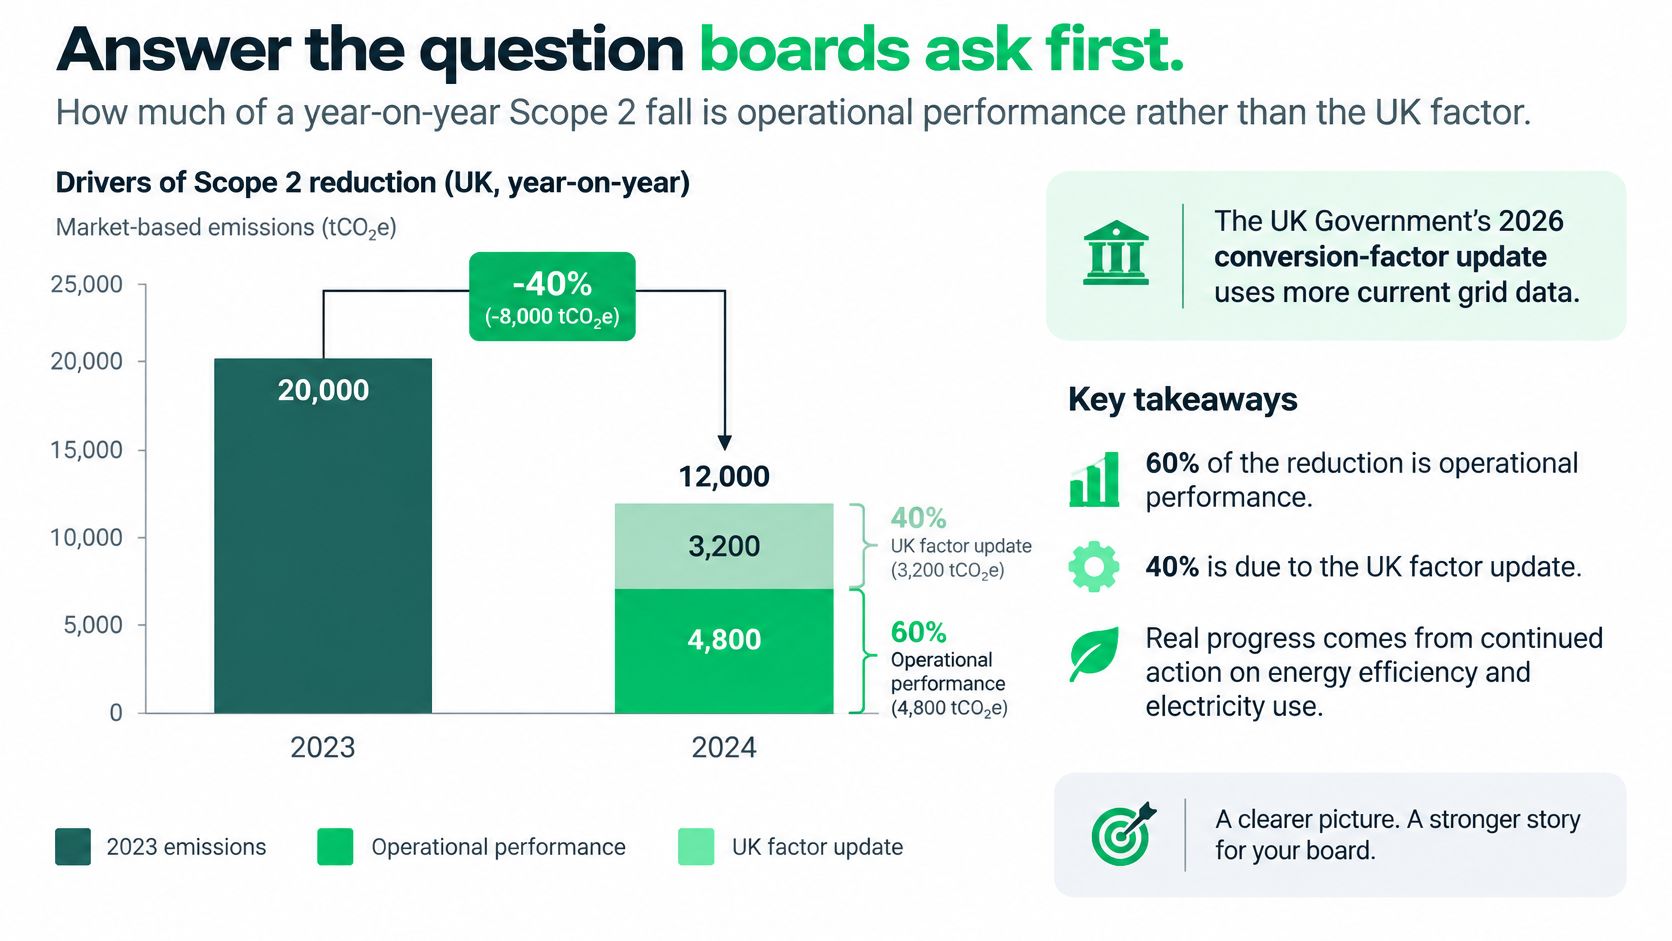
How much of a year-on-year Scope 2 fall reflects operational performance, and how much comes from a new UK factor? A board needs a reconciliation that distinguishes the published inventory from a like-for-like comparison and from the organisation's actual electricity use.
The UK Government's 2026 conversion-factor update uses more current electricity-generation data and reduces the previous two-year publication lag to approximately one year. The Government says the revised method produced a significant decrease in the electricity conversion factor compared with 2025. The UK Government's 2026 greenhouse-gas conversion-factor set describes that methodology change. A lower reported total may therefore reflect timelier grid information rather than a reduction in the organisation's electricity use.
| View | What you calculate | What a fall means | Use it for |
|---|---|---|---|
| Reported inventory | Each year's kWh multiplied by that year's official UK electricity factor | Published tonnes, including any effect of the 2026 methodology | The disclosure and prior-year comparative |
| Constant factor | Both years' kWh recalculated using one frozen factor | Change that isn't caused by a new factor | Like-for-like performance for the board |
| Activity | This year's kWh compared with last year's kWh | Whether the organisation bought less electricity | Efficiency claims in SECR, transition plans and UK SRS |
The reported inventory is the result for disclosure using the official factor applicable to each year. The constant-factor comparison holds the factor steady so the comparison isolates the effect of changes in electricity use. The activity view makes the kWh change explicit. Together, these views help readers distinguish a factor-driven movement from an operational one.
A constant-factor calculation is a comparison, not a replacement for the reported inventory. Keep the published figures intact, label the comparison method and identify the frozen factor used. Don't recalculate a prior-year figure and present it as though it had originally been reported that way.
A methodology note can state: “We calculated the reported Scope 2 figures using the applicable UK factors for each year; the 2026 factor reflects a revised method using more current electricity-generation data. We've also compared both years' electricity consumption using a constant factor and report kWh as the activity measure for efficiency claims.”
A location-based fall shouldn't be attributed to a renewable tariff. That's a procurement claim, not evidence that the site used less electricity or that the grid-average calculation changed because of the tariff.
Where UK and Voluntary Rules Ask for Scope 2
Different reporting frameworks draw on the same underlying energy records, but they don't all ask for the same presentation. Designing one well-controlled inventory can reduce duplicate work, provided the organisation knows which obligations apply and preserves the details each framework needs.
SECR brings energy use and greenhouse-gas reporting into the annual report for companies and LLPs that fall within its requirements. Its reporting includes Scope 1 and Scope 2 emissions, an intensity ratio and an energy-efficiency narrative. Purchased electricity is often central to the energy record, so the narrative should make clear whether an emissions change reflects reduced consumption or a different emissions factor.
Public-sector sustainability reporting calls for gross Scope 2 emissions and energy use in kWh. Splitting the result by energy type, such as electricity, steam, heating or cooling, can make the inventory easier to interpret. A thorough record should let a reviewer connect each reported result to the underlying supply and consumption data.
The GHG Protocol uses location-based and market-based Scope 2 methods. Where an organisation reports a market-based result, it needs evidence for the contractual instruments and the method used to calculate that figure. Keep it distinct from the location-based result rather than treating procurement evidence as a substitute for the physical-grid view.
Build one record for multiple disclosures
UK SRS S2 calls for material greenhouse-gas metrics and a method users can follow. CDP includes Scope 2 in its questionnaire, while SBTi uses gross Scope 2 within near-term and net-zero targets. In each case, keep the organisation's activity data and calculation method clear, and don't assume a contractual electricity claim replaces action to reduce emissions within a target boundary.
ESOS is an energy-audit obligation, not a conversion-factor reporting method. Its audit work can nevertheless draw on the same kWh files used to prepare the emissions inventory. Keeping energy evidence organised for both purposes makes it easier to reconcile an audit's consumption records with carbon reporting.
Before building the inventory, list the applicable obligations: SECR, public-sector reporting, GHG Protocol, UK SRS, CDP, SBTi and ESOS. Then map each one to the data and presentation it requires. ESG Consulting confirms which obligations apply before anything is built or scoped, helping organisations avoid designing a reporting process around assumptions about their duties.
Evidence and Publication Test
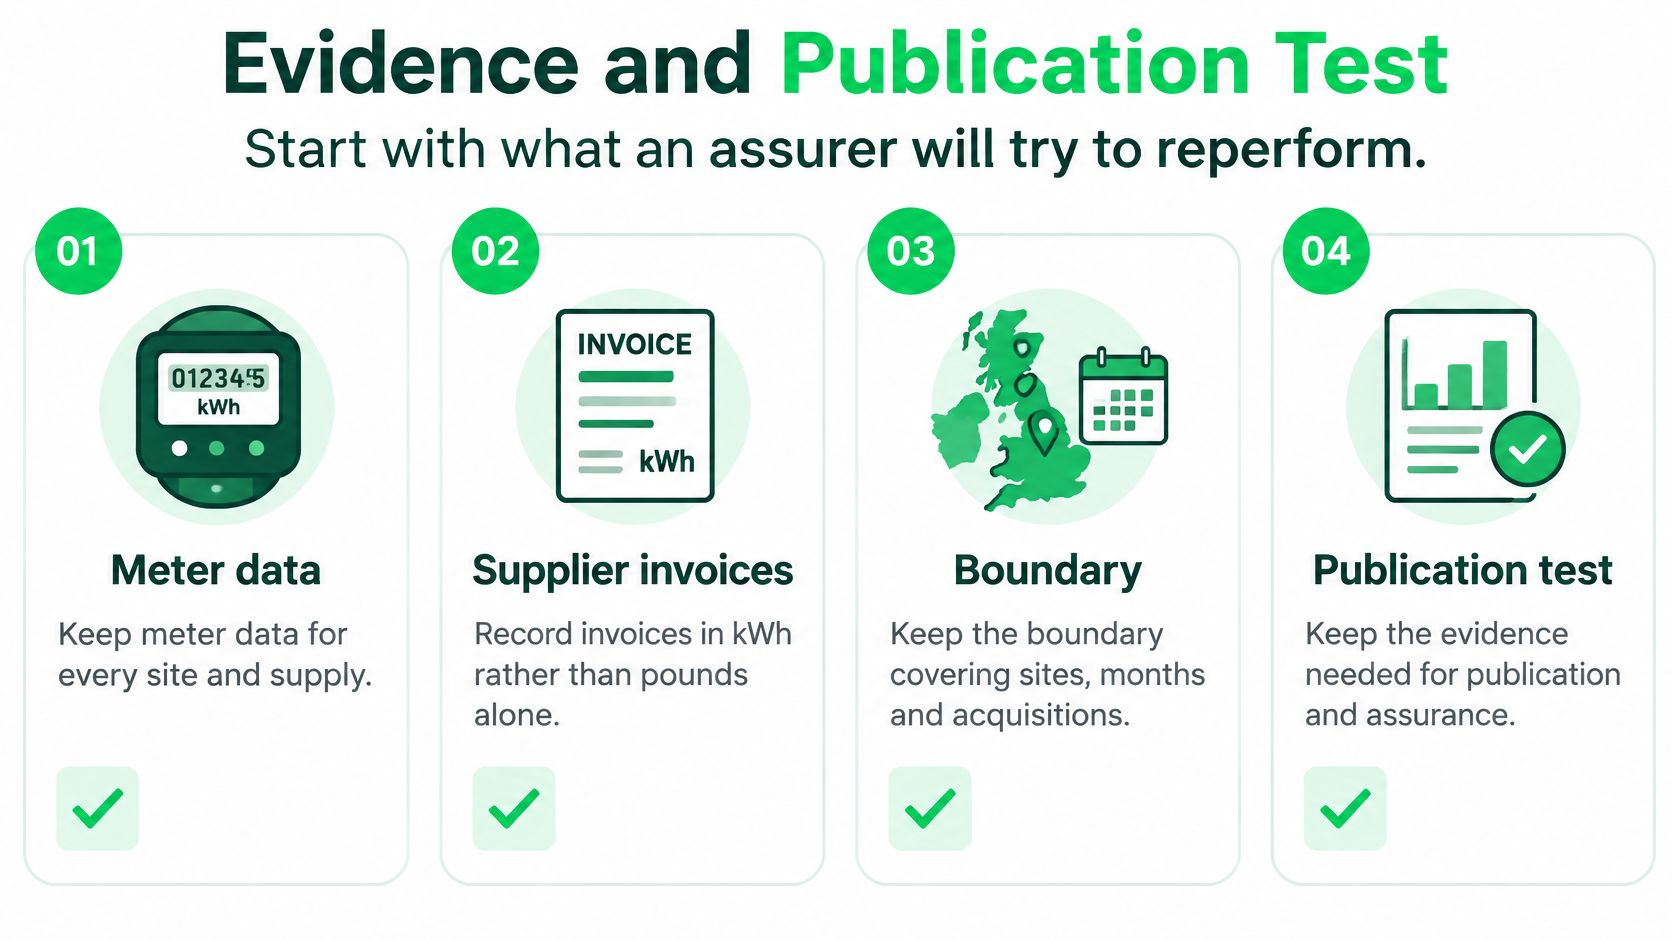
An assurer should be able to take a reported emissions line and work backwards to the activity data and method behind it. Build the evidence file so that the trail runs from the reported tonnes to the applicable factor, then to the kWh total, and finally to the underlying records.
Start with meter data for every site and supply. Add supplier invoices that show energy use in kWh, not just the amount paid. Document the reporting boundary, including the sites and months covered and any acquisitions or disposals that affect the inventory. Keep a bridge between invoice kWh and reported kWh so that adjustments, estimates or excluded supplies are visible.
For a market-based result, add the tariff terms or certificate evidence used to support the claim. Record the evidence's vintage and geographic relevance, then reconcile the market-based figure with the location-based result. The DESNZ performance report gives the wider physical-grid context: Great Britain electricity-supply intensity was 172 gCO2e/kWh in 2023, down from 199 gCO2e/kWh in 2021, and the provisional figure for 2025 was 104 gCO2e/kWh. Those figures describe electricity-supply intensity, not a particular organisation's energy efficiency.
Check the breaks that weaken a result
Look for mismatched reporting periods, such as combining calendar-year meter data with financial-year invoices. Check whether a landlord's supply has been counted as the tenant's energy as well as the landlord's. Don't use a supplier brochure factor on the location-based line, and don't net T&D into the generation result without identifying that treatment.
The 2025 UK Government factor represents electricity supplied to the grid and excludes transmission and distribution. It therefore fits the location-based generation calculation, not a combined generation-and-losses total. A renewable tariff may change a supported market-based result, but it doesn't reduce measured kWh or remove the need to explain the physical-grid calculation and method.
Apply the publication test
Before publishing, check that each line can be traced to meter or invoice evidence and the named factor year. Give the board four clear pieces of information:
- Location-based tonnes: the physical-grid result for purchased electricity.
- Market-based tonnes: the contractual result, if the organisation reports one.
- Purchased-electricity change: the current and prior-period kWh comparison.
- Methodology explanation: one sentence separating the UK factor effect from operational change.
Hold the disclosure if the kWh total can't be reconciled, the factor year is unclear, or a procurement claim has replaced the physical-grid result without explanation. Publish when the energy data, factor and reporting method are traceable and the presentation meets the relevant UK duty. ESG Consulting prepares SECR Scope 1 and 2 inventories, intensity ratios and the required energy-efficiency narrative, with figures traced to source data and documented methodology, boundaries and assumptions for assurance.
If your organisation needs a defensible Scope 2 inventory, ESG Consulting can help map the applicable reporting duties, reconcile kWh with the right UK factors and document the difference between operational change and factor-driven movement. Visit ESG Consulting to discuss the evidence and reporting approach your organisation needs.