scope 3 emissions definition, GHG Protocol, Scope 3 categories, UK carbon reporting, value chain emissions
Scope 3 Emissions Definition for UK Reporting
By ESG Consulting Team · · 20 min read
Scope 3 is all other indirect greenhouse gas emissions in an organisation's value chain that the reporting organisation doesn't own or control, structured as 15 upstream and downstream categories. In UK practice, you disclose the categories that are material rather than automatically reporting all 15 in full.
That second point challenges the most popular advice you'll hear. You're often told to calculate your Scope 3, publish the total, and compare it with competitors, peers, or last year's number. Don't start there. A total without its category list, boundary, and method tells you very little, and a smaller total can mean a narrower inventory. The Scope 3 emissions definition is the easy part. Deciding what your number covers, and how much you can trust it, is the work.
Table of Contents
- What Scope 3 Means and Why Totals Differ
- The Fifteen Categories in Plain English
- What UK Public Contracts Actually Require
- Where the Footprint Actually Sits
- How to Build a Defensible Scope 3 Inventory
- Choose the Categories You Will Disclose
What Scope 3 Means and Why Totals Differ
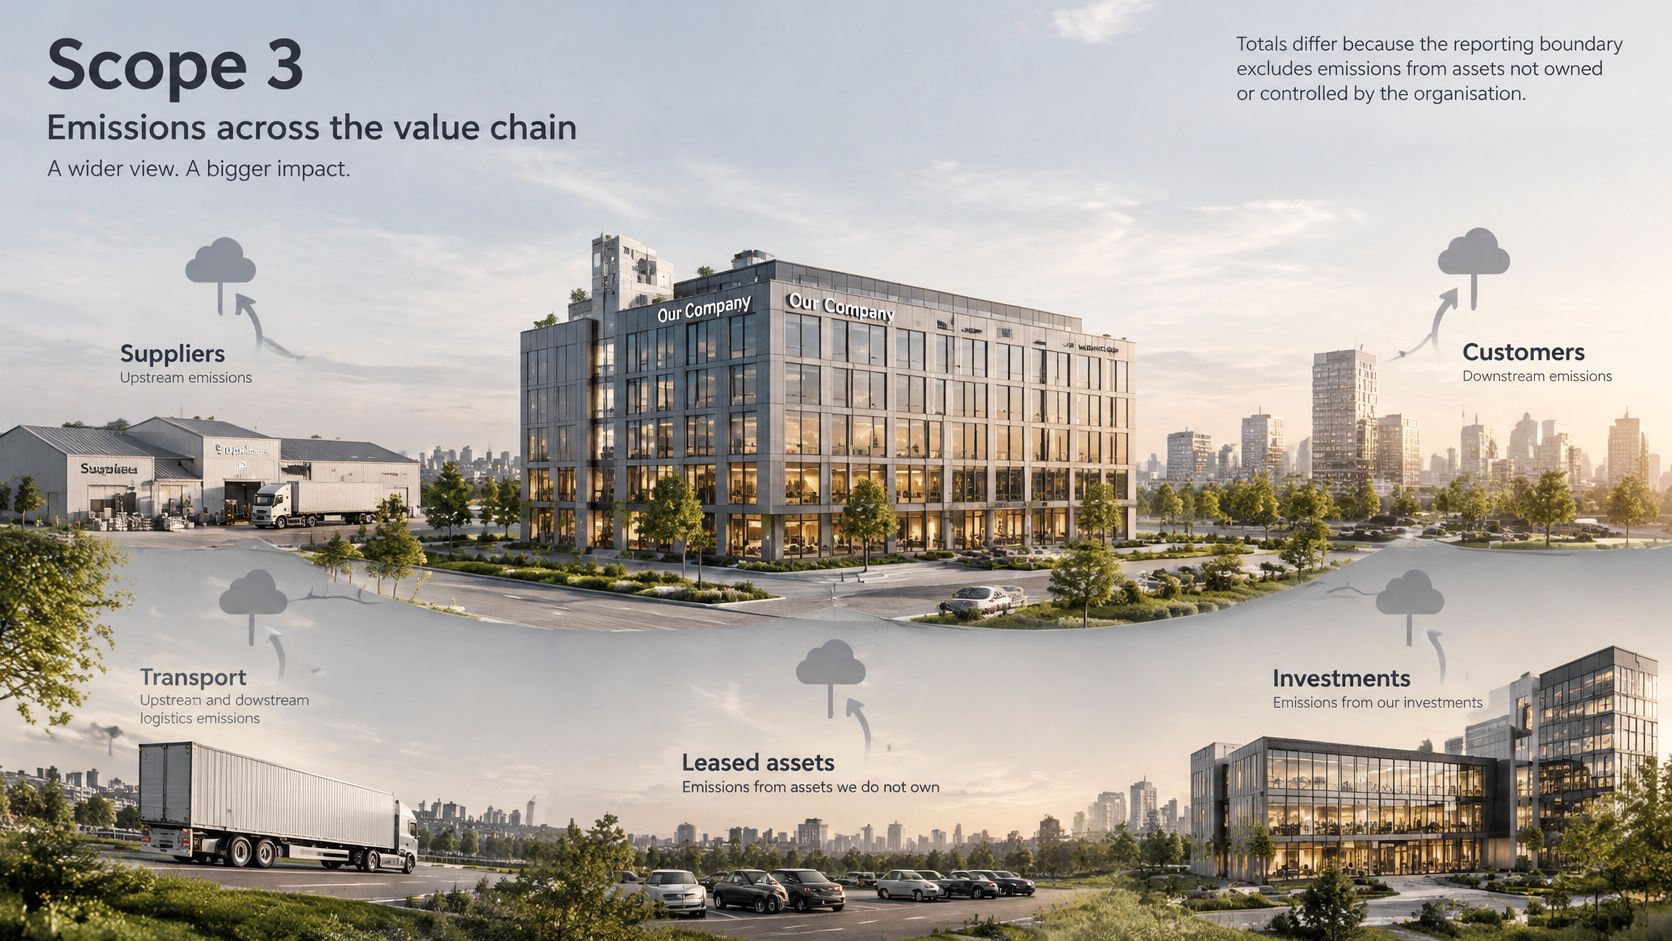
The UK Government's sustainability reporting guidance for 2025 to 2026 defines Scope 3 as all other indirect greenhouse gas emissions arising from an organisation's value chain that are not owned or controlled by the reporting entity, and it adopts the GHG Protocol structure of 15 categories covering upstream and downstream activities. Those categories run from purchased goods and services, capital goods, waste, business travel, and employee commuting through to processing and use of sold products, product end of life, franchises, and investments. In plain terms, Scope 3 reaches beyond your own sites. It can include a supplier making your inputs, a haulier moving them, a customer using what you sold, and an investee using money you provided.
Say a bakery runs one site. Gas burned in its own ovens is Scope 1, because the bakery controls the source directly. Electricity it buys for lighting and refrigeration is Scope 2, because the emissions happen at the power station but arise from energy the bakery purchases. Almost everything else connected with getting bread to a customer sits in Scope 3. Flour, yeast, and packaging count as purchased goods. A hired van delivering to cafés counts as transport. Staff driving to work, waste sent for treatment, and a customer's toaster using the bread all fall outside the bakery's ownership or control, yet they exist because the bakery trades.
Why the Same Activity Appears Twice
New reporters often spot an overlap and assume someone has made an error. A component manufacturer burns gas in its boiler and reports that gas as its own Scope 1. You buy the component, so you report the manufacturing emissions inside your purchased goods category. Both figures are correct from each organisation's perspective.
Value chain accounting is designed to show the emissions consequences of your activities, not to create one global ledger where every tonne appears once. UK guidance is explicit that supply chain emissions may include emissions generated by suppliers even when those emissions would be Scope 1, 2, or 3 for the supplier itself. You don't remove them because your supplier has already counted them. You classify them according to your relationship with the activity. If you excluded everything a supplier reported, most buyers would report almost no supply chain footprint at all.
Practical rule: Don't ask whether an activity has already been counted somewhere else. Ask who owns or controls the source in relation to your organisation, then place it in the right scope for you.
Three Layers People Mix Up
Most confusion comes from treating three different things as one. The UK public sector emissions measurement and reporting guidance states there's no general minimum Scope 3 reporting requirement, and entities must consider Scope 3 and report material information for primary users. That single sentence separates the definition from the disclosure duty.
- The definition: Scope 3 covers indirect value chain emissions outside your ownership or control, organised into 15 categories.
- Your inventory boundary: These are the categories you choose, or judge relevant enough, to measure in your own footprint.
- Your disclosure boundary: These are the categories a framework, contract, investor, or customer expects you to publish in a particular report.
Those three layers rarely match perfectly. An organisation can accept the full definition, screen all 15 categories, quantify eight, and disclose five because only five are material to its primary users. Another organisation in the same sector might quantify a different eight. Both totals can be valid, and a direct ranking of the two headline numbers can still mislead you.
Materiality is not a permission slip to ignore awkward categories. It means you consider what could influence the decisions of investors, boards, lenders, customers, and other primary users. Purchased goods might dominate a retailer's risk exposure, while use of sold products matters more to a vehicle or boiler manufacturer. For a lender or investor, financed emissions can dwarf office travel. Under UK Sustainability Reporting Standards and board level climate risk reporting, the question is whether omitting a category would change a reader's understanding of your transition risk, costs, or dependencies. If it would, you cannot leave it out without saying so.
Boundaries Can Move an Activity Between Scopes
Consolidation choices create another source of difference. Under an operational control approach, you report emissions from operations you control day to day. Under financial control or equity share, the answer can change, particularly for joint ventures and leased assets. One lease can therefore sit in Scope 1 and 2 for the party controlling the energy supply, and in Scope 3 for the other party. Neither party has necessarily made a mistake. They've applied different positions in the same contractual arrangement, or different consolidation rules across a group.
This is why you should never treat a smaller Scope 3 total as automatically better. It might reflect lower physical emissions. It might also reflect excluded categories, a different group boundary, weaker supplier data, or a reporting year with less purchasing. Before you compare two totals, read the basis of reporting. Check the organisational boundary, the category list, the exclusions, the materiality statement, and the calculation methods. If those notes aren't published, you don't have a like for like comparison, whatever the dashboard suggests.
Two valid Scope 3 totals may describe different slices of two value chains. Compare the boundaries first, then compare the numbers.
The Fifteen Categories in Plain English
Use this table as a lookup first. Match the activity in front of you to a category, then check the boundary notes underneath for the pairs people most often confuse.
| Category | Position | What the boundary covers | Typical activity |
|---|---|---|---|
| 1 Purchased goods and services | Upstream | Cradle to gate emissions of bought goods and services | Raw materials and outsourced services |
| 2 Capital goods | Upstream | Emissions embodied in long lived purchased assets | Plant, vehicles and IT hardware |
| 3 Fuel and energy related activities | Upstream | Upstream fuel and energy emissions outside Scopes 1 and 2 | Extraction, refining and transmission losses |
| 4 Upstream transportation and distribution | Upstream | Inbound logistics in third party vehicles within the reporter's boundary | Supplier deliveries paid or arranged by the buyer |
| 5 Waste generated in operations | Upstream | Third party treatment of waste from the reporter's operations | Landfill, incineration and recycling |
| 6 Business travel | Upstream | Employee travel in transport the organisation does not own or control | Flights, rail, hotel stays and taxis |
| 7 Employee commuting | Upstream | Travel between home and workplace in vehicles the company does not own or operate | Cars, buses and trains used to commute |
| 8 Upstream leased assets | Upstream | Operation of assets leased by the reporter and excluded from Scopes 1 and 2 | A leased office where the landlord controls energy |
| 9 Downstream transportation and distribution | Downstream | Outbound logistics after sale or not paid for by the reporter | Customer delivery by a third party |
| 10 Processing of sold products | Downstream | Further processing by a third party before the end user | An intermediate product sent for finishing |
| 11 Use of sold products | Downstream | Emissions from customers using sold goods or services | Fuel burned or electricity used by a sold product |
| 12 End of life treatment of sold products | Downstream | Disposal and treatment after customer use | Recycling, landfill or incineration of sold goods |
| 13 Downstream leased assets | Downstream | Operation of owned assets leased to others and outside Scopes 1 and 2 | Tenant controlled energy in a let building |
| 14 Franchises | Downstream | Operations of franchises not already in Scopes 1 or 2 | Franchisee sites |
| 15 Investments | Downstream | Emissions associated with equity, debt or project investments | Financed emissions of an investee |
Eight Upstream and Seven Downstream
The first eight categories happen before, or alongside, your own operations. They're mostly about what you buy and how your people and suppliers move. Purchased goods and services uses a cradle to gate boundary, so it covers extraction, manufacturing, and transport up to the point you receive the item or service. If a bought asset is long lived and capitalised, such as plant, a vehicle, or a server, it belongs in capital goods when purchased instead. Don't spread it informally across years just because finance depreciates it that way.
Fuel and energy related activities catches the upstream part of energy you already know from Scopes 1 and 2. If you burn gas, Scope 1 covers combustion in your boiler. Category 3 covers extracting, refining, and transporting that gas, plus losses when purchased electricity travels through the grid. It's a companion category, not a second count of the same combustion.
The Boundaries People Get Wrong
Transport splits on your commercial relationship with the movement, not on direction. Inbound deliveries in third party vehicles that sit within your reporting boundary go in category 4. Outbound movement after sale, or movement you don't pay for or control, goes in category 9. A journey can therefore change category when contract terms change, even if the same lorry drives the same route.
Keep business travel and commuting separate. A train to a client meeting is business travel. The same employee's train from home to the usual workplace is employee commuting, provided the vehicle isn't owned or operated by your company. Waste is different again. It covers a third party treating waste generated in your operations, not waste a customer creates after using your product. That later disposal belongs in category 12.
The two lease categories depend on who leases and who controls the asset. Category 8 covers assets you lease in but don't already include in Scopes 1 and 2. Category 13 covers assets you own and lease out to someone else. Read the lease and the energy contract together. The label on the property schedule won't answer the question on its own.
Franchises and investments widen the lens beyond your supply chain. A franchisor can report franchisee operations it doesn't consolidate elsewhere. An investor or lender can report emissions associated with equity, debt, and project investments, often called financed emissions. For some financial organisations, that one category is the footprint in practical terms.
Two UK edges catch people out. Homeworking and purchased materials are treated as Scope 3 sources in UK conversion factor practice, so don't dismiss them as informal estimates outside the inventory. A category with no activity is omitted rather than forced to zero. If you have no franchises, say the category doesn't occur. Inclusion in the 15 category list isn't a duty to quantify every row.
What UK Public Contracts Actually Require
For many UK suppliers, Scope 3 stopped being theoretical when it entered procurement. The UK Government's PPN 006 frequently asked questions on Carbon Reduction Plans explain that Scope 3 became a practical requirement through Carbon Reduction Plans under Procurement Policy Note 06/21, issued in 2021, and developed through later standards. The government states Scope 3 emissions often constitute the majority of an organisation's total greenhouse gas footprint, although the proportion varies substantially by sector and business model. Majority is a warning to look, not a percentage you can apply to your own business.
For suppliers bidding for major central government contracts, the required boundary is UK Scope 1 and Scope 2 plus five specified Scope 3 categories. Those five are upstream transportation and distribution, waste generated in operations, business travel, employee commuting, and downstream transportation and distribution. That's a concrete milestone, but it's not a full value chain inventory.
| Boundary | What is included | Who it applies to | What it does not prove |
|---|---|---|---|
| GHG Protocol Scope 3 definition | All 15 upstream and downstream categories that occur | Any organisation mapping its value chain | That every category has been quantified |
| UK materiality disclosure | Categories material to primary users, with no general minimum | Public bodies and reporters following UK sustainability guidance | That two organisations used the same category set |
| PPN 006 Carbon Reduction Plan | UK Scope 1, UK Scope 2 and five specified Scope 3 categories | Suppliers bidding for covered major central government contracts | That purchased goods, product use or investments were measured |
| The five specified categories | Upstream transport, operational waste, business travel, employee commuting, downstream transport | The same contract bidders | That those five are the largest categories in every sector |
Read the Activity Tests Before You Copy Numbers
The technical standard defines the five categories by activity. Employee commuting covers travel between employees' homes and workplaces in vehicles not owned or operated by the company. The transport categories cover relevant logistics services and their operational energy emissions, not every tonne moved anywhere in your value chain. Waste means waste generated in your operations. Business travel means work journeys outside the normal commute.
Those tests matter when you already have a voluntary inventory. Don't paste in a category total built on a different boundary and assume it'll pass. Check who's travelling, who owns the vehicle, who pays for the logistics service, and whether the activity sits inside the specified UK boundary for the plan. A well built voluntary footprint can still need restructuring for a bid.
A passed Carbon Reduction Plan proves you met a defined contract boundary. It doesn't prove you've measured your whole value chain.
Purchased goods, capital goods, use of sold products, and investments can dominate a manufacturer, retailer, or lender, yet they sit outside this five category subset. Eligibility therefore tells a buyer very little about your largest transition risks. For organisations outside central government bidding, the five categories make a sensible screening set because they're activity based and often measurable from travel, waste, and logistics records. Screening isn't a materiality conclusion. You still need to ask whether the categories outside the five are where your footprint sits.
Where the Footprint Actually Sits
The clearest UK illustration comes from public sector technology reporting. This visual summary shows how much of that footprint sits outside direct operations.
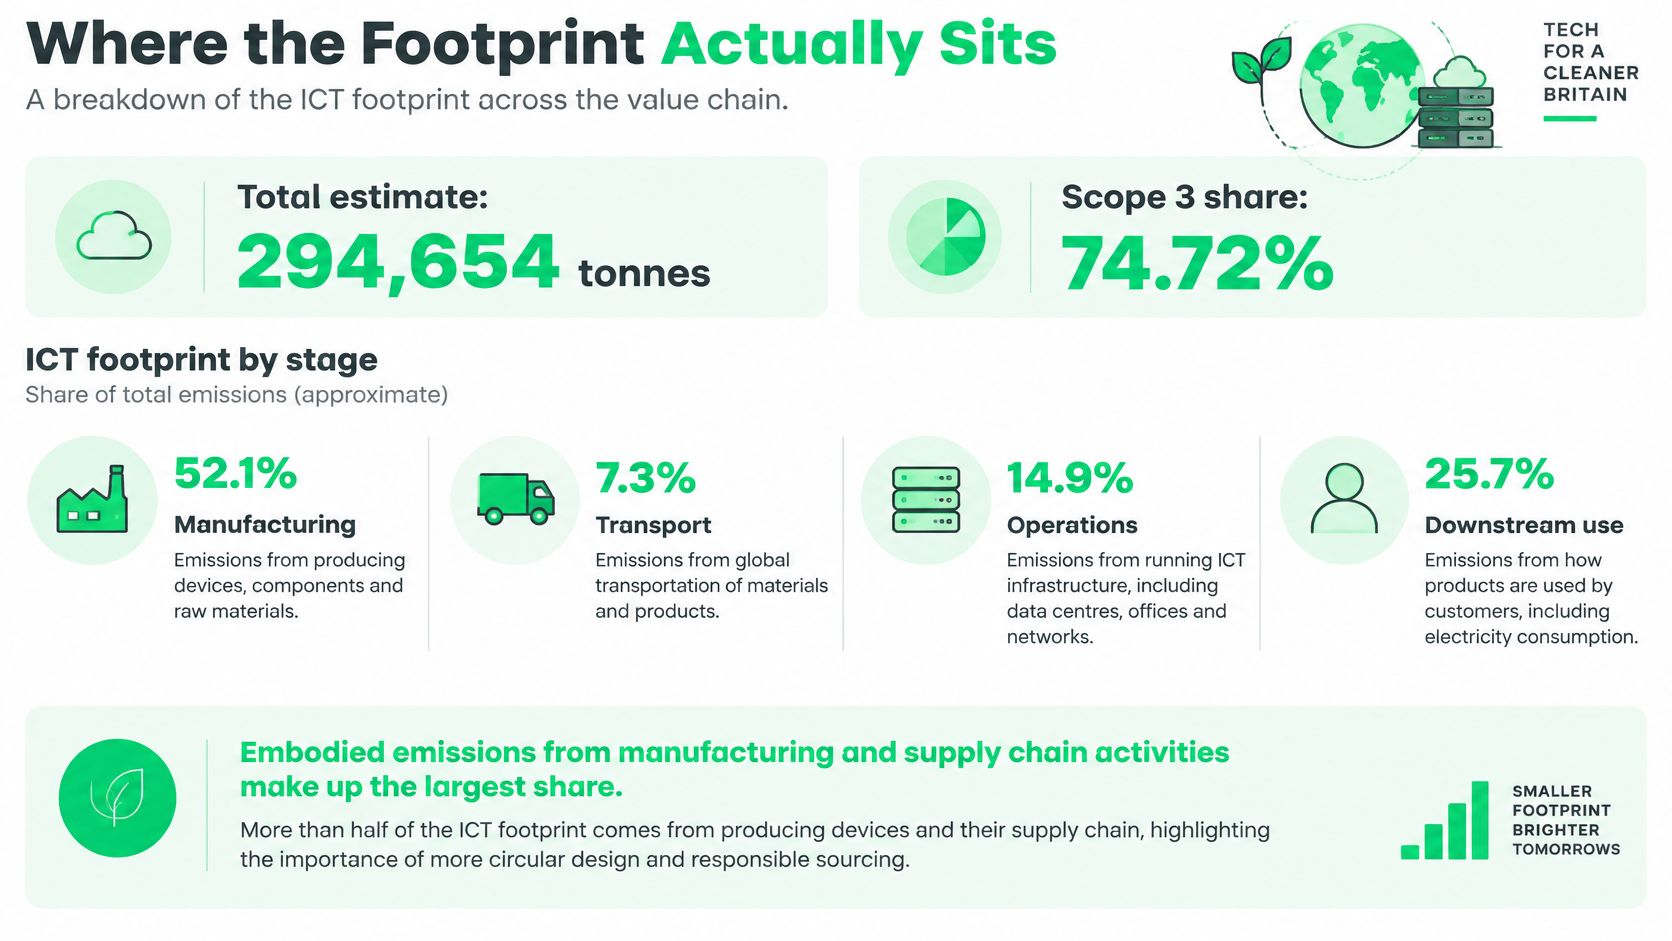
The UK Government's Greening Government ICT annual report for 2024 to 2025 estimated 294,654 tonnes of emissions, with 74.72% classified as Scope 3, and embodied emissions from manufacturing and distribution were major sources. A new desktop computer was assigned 205 kgCO2e, compared with 163 kgCO2e for a laptop and 260 kgCO2e for a desktop monitor. The monitor figure surprises people, which is exactly the point. The piece of kit doesn't need to burn fuel on your premises to carry a substantial footprint.
You can cut office electricity, extend device life, and improve data centre efficiency, yet still leave most of the ICT footprint in factories and distribution networks you don't control. That doesn't make operational savings unimportant. It means a plan focused only on meters and bills will miss the largest decisions, such as how much hardware you buy, how long you keep it, and which products you specify. Scope 3 shifts attention from the energy manager alone to procurement, IT strategy, product design, and finance.
Estimates Are Useful Within Limits
Those ICT figures depend on product assumptions, emission factors, and procurement data. They aren't built from a complete set of supplier specific measurements for every device. Public sector inventories often mix activity data from some suppliers with expenditure based estimates for the rest. That's normal at an early stage, but you need to know what each method can support.
This video walkthrough is useful background before you judge a published footprint by its headline total alone.
A spend based estimate multiplies money spent by an emissions intensity for a type of purchase. It's defensible for screening a long tail of small suppliers, identifying hotspots, and making a first materiality pass when better data doesn't exist. It's a weak basis for claiming a precise reduction. If prices rise, a supplier changes, or finance recodes expenditure, the calculated emissions can move without any physical change in manufacturing or transport. You might report progress that never happened, or hide progress that did.
Get primary supplier or product data when a category is material, when a public target depends on it, when you'll compare suppliers in a tender, or when an assurance provider will test the figure. Start with the purchases that drive the result, not with every low value supplier at once. Ask for product footprints, activity data, boundaries, and the year covered. A supplier's marketing claim that a product is greener won't survive those questions unless the method sits behind it.
Disclosure practice still lags operational reporting. In 2023, 56% of UK based companies disclosed Scope 3 emissions, compared with 74% that disclosed Scope 1 and 2 emissions, according to Bain & Company's analysis of CDP data published in 2024. Many published footprints therefore stop at the factory gate or office door.
Coverage is widening, but scrutiny is widening faster. In the 2024 reporting year, the UK government included Scope 3 hardware and waste emissions for the first time in its ICT emissions reporting, according to the Cabinet Office's 2023 to 2024 Greening Government Commitments ICT annual report. Readers increasingly want numbers that are auditable and decision useful, not just a broader label beside the total.
How to Build a Defensible Scope 3 Inventory
Build the inventory in one sequence and don't jump straight to supplier questionnaires. The process summary below shows the logic, then the six steps give you the working detail.
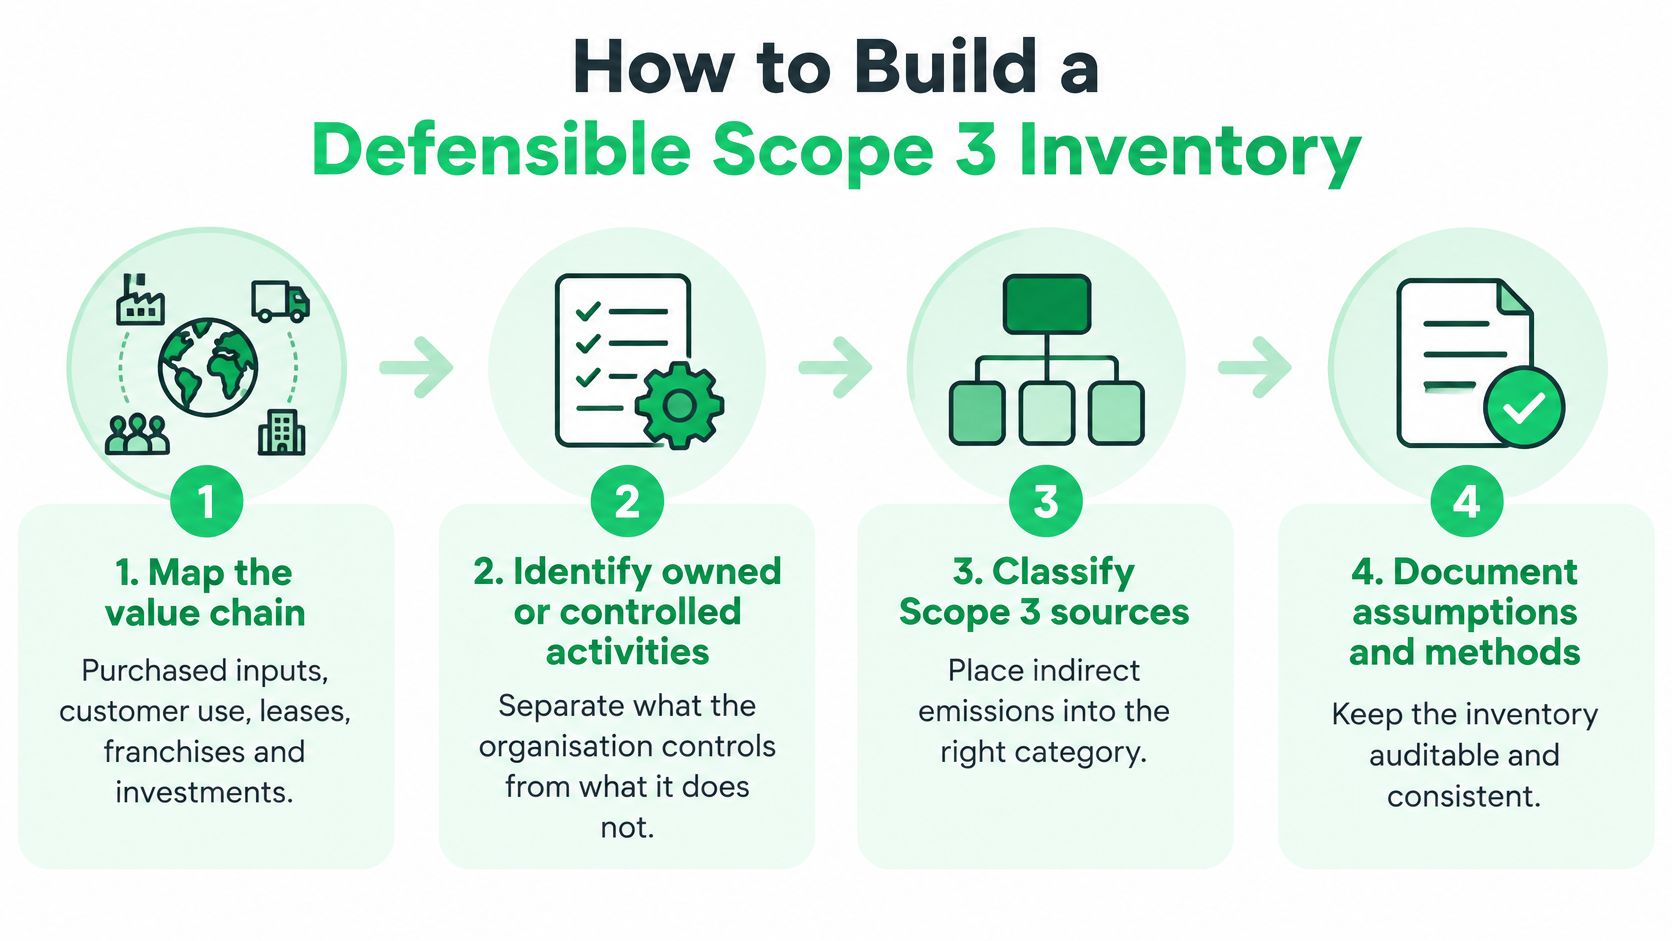
- Map the value chain: Trace purchased inputs, outsourced services, logistics, product use, disposal, leases, franchises, and investments. Mark what you own or control, because those sources usually stay in Scope 1 or 2.
- Screen all 15 categories: For each one, record whether it occurs, its likely scale, and whether you can influence it. Use spend, volumes, travel records, or asset registers for the first pass, and write down a reason for every exclusion.
- Apply the framework test: Decide which categories are material to primary users, which a contract already names, and which a customer, lender, NHS buyer, or science based target expects. A category can enter your disclosure through any of those doors.
- Choose a data tier for each category: Use supplier specific or product specific data first for material categories. Use activity data with UK government conversion factors where you know distance, weight, energy, or waste tonnage. Reserve expenditure estimates for the long tail.
- Document the trail: Keep the boundary, reporting period, emission factors, assumptions, data owners, and uncertainty in one method note. An assurance provider should be able to trace each figure back to source data without interviewing the person who built the spreadsheet.
- Report the total with its workings: Publish the category list, methods, and exclusions beside the number. Don't claim a reduction that comes only from changing a spend based factor, a price, or an accounting code.
Two Failure Points to Avoid
Copying a supplier's published footprint straight into purchased goods looks efficient, but it can corrupt your categories. The supplier's total may include its own commuting, waste, product use, or investments. If you don't unpick its scopes and boundaries, you can count items in the wrong place, or count the same activity again in another of your categories. Ask what the supplier included and what share relates to the goods or service you bought.
The second failure is treating homeworking, waste, or transmission losses as outside Scope 3 because they feel peripheral. UK factor guidance treats them as Scope 3 sources. Peripheral doesn't mean non existent. Screen them, estimate them if they're small, and explain any exclusion on materiality grounds.
Test of usefulness: A manager should be able to see which category drives the footprint, which supplier or decision influences it, and which figures are still estimates.
Perfect data isn't the entry condition. A defensible first inventory is transparent about coverage, uses better data where the emissions and decisions are largest, and improves in a planned order. That's more credible than a precise looking total built from one method applied to everything.
Choose the Categories You Will Disclose
Before you publish any Scope 3 total, write three short lists. List A contains categories that clearly occur in your value chain. List B contains categories likely to be material to investors, board members, customers, lenders, or other primary users. List C contains categories a live obligation already names, such as the five in a Carbon Reduction Plan for a covered major central government contract.
Disclose the union of List B and List C. Keep List A as your screening record so you can show you considered the rest, and state exclusions in the same note as the number. A single grand total without that note invites false comparison and leaves your board unable to explain what's missing. If a category occurs but isn't material yet, say so and give the reason. If it doesn't occur, say that instead. Those are different statements.
A Proportionate First Cycle
You don't need supplier specific data for every category in year one. Quantify activity based categories such as waste, business travel, and commuting with conversion factors, because you can usually obtain tonnages, distances, receipts, or survey responses. Screen purchased goods with spend to identify hotspots, then escalate only those hotspots to supplier or product data. That order puts effort where a sourcing decision can change the result.
- Start with records you already hold: Use travel bookings, expense claims, waste transfer notes, fleet and logistics data, asset registers, and the purchase ledger.
- Label the method by category: Mark each figure as supplier specific, activity based, or spend based, so readers don't treat estimates as measurements.
- Set the escalation rule now: Decide which hotspot, target, tender, or assurance trigger will move a category to primary data next cycle.
Applicability comes before inventory design. ESG Consulting confirms which obligations apply to a client before anything is built or scoped, because SECR, ESOS, UK SRS, a contract plan, and a voluntary target don't ask for identical evidence. The definition alone doesn't create a duty to report all 15 categories. Confirm which framework and audience you're serving, then build the boundary for that purpose.
Our Scope 3 Emissions Inventory service uses value chain mapping and supplier engagement to build a Scope 3 footprint, and every figure traces back to source data with methodology, boundaries, and assumptions documented for your auditor or assurance provider. The decision for this quarter isn't whether Scope 3 exists. It's which categories you'll stand behind, which estimates you'll label transparently, and which numbers are strong enough to guide spending.
If you need to decide which Scope 3 categories to measure, disclose, or improve before a bid, board report, or target submission, we can map your value chain, engage priority suppliers, and document the evidence trail behind every figure. Visit ESG Consulting to speak with a specialist about building an inventory your auditor, customers, and board can rely on.