SECR reporting template, SECR compliance, Scope 1 and 2 reporting, UK energy reporting, intensity ratio
SECR Reporting Template: Annotated Fields and Examples
By ESG Consulting Team · · 17 min read
You're staring at a folder of utility invoices, a fuel-card export that doesn't quite match the ledger, and a draft Directors' Report with an empty space where the energy and carbon disclosure should sit. Finance wants a number by Friday. The board wants wording it can approve. What you need isn't a prettier table, it's a SECR reporting template that shows where every figure came from, how you calculated it, and who checked it.
Table of Contents
- SECR Template Blocks at a Glance
- Applicability and Group Boundary Checks
- Scope 1 and Scope 2 Reporting Rules
- Annotated Energy and Emissions Fields
- Choosing an Intensity Ratio That Holds Up
- How to Write the Energy-Efficiency Narrative
- Evidence Trail and Assurance Checks
- Confirm Your Template Before Board Sign-Off
SECR Template Blocks at a Glance
The UK's Energy and Carbon Reporting framework became mandatory for reporting periods beginning on or after 1 April 2019, and the disclosure sits inside the annual report rather than in a voluntary sustainability summary, as explained in the UK Government's environmental reporting guidelines. For companies, it belongs in the Directors' Report filed with Companies House. LLPs place it in their equivalent annual report. That filing route sets the standard. Your template is a financial reporting control document, so each block needs evidence, a method, and a named owner behind it.
I would build the template as one workbook with a tab for each block. That gives you a working SECR reporting template without hunting for an external file, and it keeps the calculation trail in one place when finance asks how a total was reached.
| Template block | What it records | Key fields | Owner |
|---|---|---|---|
| Entity and applicability | Who reports and why | Entity name, financial year, size test result, quoted status | Company secretary |
| Boundary and perimeter | Which entities and sites are included | Consolidation boundary, leased sites, exclusions with reasons | Finance lead |
| Energy and emissions data | Consumption and tCO2e | kWh by source, tCO2e, current and comparative year | Sustainability lead |
| Methodology | How figures were calculated | Conversion-factor year, estimation method, data gaps | Sustainability lead |
| Intensity ratio | Performance per unit of activity | Numerator, denominator, rationale | Sustainability lead |
| Efficiency actions | What was done and what it saved | Action, date, energy source, saving, evidence reference | Operations lead |
| Reconciliation | Changes to prior-year figures | Restatements, acquisitions, disposals, methodology changes | Finance reviewer |
| Sign-off | Who approved the figures | Preparer, reviewer, company secretarial check, board date | Board or delegated committee |
Keep that overview open as you work. The eight blocks run in sequence for a reason. Applicability comes before data collection, methodology sits beside the numbers it explains, and sign-off closes the file only once reconciliation is complete.
A number without its source record, factor year, and reviewer isn't finished. It's a draft.
Core content across the blocks stays consistent. You're recording annual energy use, greenhouse gas emissions, at least one intensity ratio, and a narrative on energy efficiency action taken in the period. The tabs require you to prove each element rather than type it straight into the annual report and hope nobody asks questions later.
Applicability and Group Boundary Checks
A finance lead gathers invoices for every site on the operations list, builds a tidy energy table, then discovers that two of those sites sit in a joint venture outside the reporting perimeter. The numbers are fine. The boundary is wrong. Settle applicability before anyone opens a utility portal. This stage is the cheapest control in the process, and the one that saves a rebuild.
The Size Test
For large unquoted UK companies and LLPs, apply the three-part size test: more than 250 employees, turnover above £36 million, and a balance-sheet total above £18 million. An entity is generally in scope when it meets at least two of the three. Quoted companies are in scope regardless of size. Small companies and LLPs below the test usually sit outside the regime. Apply each limb separately and record the result, including the employee count used for the test. A copied threshold summary is not evidence.
| Entity type | Size or status test | Thresholds | Reporting scope |
|---|---|---|---|
| Quoted company | Listed on a UK, EEA, NYSE or NASDAQ market | No size test applies | Global energy use and emissions, with UK figures |
| Large unquoted company | At least two of three thresholds met | More than 250 employees; turnover above £36 million; balance sheet above £18 million | UK energy use and associated emissions |
| Large LLP | At least two of three thresholds met | Same thresholds as large unquoted companies | UK energy use and associated emissions |
| Small company or LLP | Below the size test | Fewer than two thresholds met | Usually outside SECR |
Mapping the Group Perimeter
Groups create the hardest boundary questions. A parent may prepare consolidated disclosures, a subsidiary may rely on the group report, and a subsidiary that would not qualify alone may still be included in a group perimeter. One consolidated table does not answer every legal entity. Map entity by entity, then site by site, and record the treatment applied.
Leased and shared premises need the same discipline. Record who consumes the energy, who controls the meter, and whether the landlord or tenant reports it, so the same site is not counted twice or missed by both parties.
Work through four steps in order:
- Confirm status: record whether the entity is quoted or unquoted, and where it is listed if quoted.
- Test size: apply the three thresholds and record the pass or fail for each one separately.
- Map the boundary: list every entity and site inside the perimeter, including leased and shared premises.
- Document exclusions: state each exclusion and its reason, including whether a low energy exemption is claimed, the energy figure relied on, and the period covered.
ESG Consulting confirms which obligations apply before anything is built or scoped, and tells clients when an obligation does not apply and when a rating can wait. Whatever route you take, file one output from this stage: a signed applicability note. It should show the size-test result, the boundary map, and every exclusion with its reason. Treat that note as part of the annual-report control file, not a memo for the drawer. Without it, every later figure rests on an untested assumption.
Scope 1 and Scope 2 Reporting Rules
Scope 1 covers direct emissions from sources you own or control, such as gas burned in your boilers and fuel used in your vehicles. Scope 2 covers purchased energy, mainly electricity, plus purchased heat, steam, and cooling where you buy them. If a line in your template can't be assigned to one of those definitions in a single sentence, it isn't ready for a factor.
Columns Every Data Line Needs
Give each activity line its own row and the same set of columns. Consistency here is what lets a reviewer reperform your work without interviewing you.
- Scope tag: Scope 1, Scope 2, or the specified business travel Scope 3 component where it applies.
- Activity: Gas combustion, purchased electricity, diesel for owned vehicles, and so on.
- Unit: kWh, litres, or miles as recorded at source, before conversion.
- Conversion factor and factor year: The exact UK Government factor used and the year it belongs to.
- Source record: Invoice, meter read, fuel-card statement, or mileage log reference.
- Data tag: Measured, invoiced, or estimated.
One Worked Calculation
Say you've recorded 250,000 kWh of purchased electricity for the year. You multiply that consumption by the UK Government conversion factor for the year the electricity was consumed, and the result is your Scope 2 figure in tonnes of CO2e. Record the factor value and its year in the methodology block, not just in a spreadsheet formula nobody will open again.
The factor year matters because grid factors change as the electricity mix changes. Applying this year's factor to last year's consumption flatters or penalises you for something you didn't do. If you've used a prior year factor for any line, say so and explain why.
Where Scope Tagging Breaks
Four errors account for most review comments:
- Mixed lines: Scope 1 fuel and Scope 2 electricity combined into a single energy total with one factor applied.
- Wrong unit: An electricity factor applied to fuel recorded in litres, instead of converting litres to energy first.
- Double counting: A landlord supplied site counted by both landlord and tenant, or by two group entities.
- Undated factors: An outdated factor used without stating its version, so the calculation can't be reperformed.
Keep voluntary Scope 3 categories in a separate table entirely. The specified business travel component belongs in the statutory disclosure where your entity type requires it. Everything else, such as purchased goods or commuting, is useful management information, but mixing it into the statutory table invites a reader to treat estimates as filed figures. A clean scope section is easy to recognise. Every line is tagged, every factor is dated, and every exclusion carries a reason a director could repeat out loud.
Annotated Energy and Emissions Fields
The core data block is where templates look tidy and fail without warning. Under the UK Government's sustainability reporting guidance, the data table should hold current and comparative years, energy consumption in kWh, gross emissions in tonnes of CO2e, at least one intensity ratio, the methodology, and the efficiency narrative. Show the two years side by side. Never collapse them into one total, because the comparative column is what makes movement visible and challengeable.
| Field | What to enter | Evidence and tag |
|---|---|---|
| Purchased electricity | kWh and tCO2e for current and comparative years | Supplier invoice or half-hourly meter data; tag measured, invoiced or estimated |
| Gas | kWh and tCO2e converted with the factor for the year | Meter reads or invoices; factor year recorded in the methodology block |
| Transport fuel | Litres converted to kWh, then tCO2e | Fuel-card statements and mileage logs for owned or controlled vehicles |
| On-site generation | Generated kWh and exported kWh shown separately | Generation meter readings; explanatory note where material |
| Estimated line | Estimation method, percentage of total consumption covered, reason | Prior-year usage pro-rated by days, for example; landlord-controlled sites |
| Efficiency action | Action, implementation date, energy source, saving | Measured or expected label; evidence reference |
| Reconciliation | Restatements, acquisitions, disposals, method changes | Original and amended figures side by side with the reason for the change |
Electricity, Gas, and Transport Fuel
Purchased electricity comes from supplier invoices or half-hourly meter data where you have it. Tag every site figure as measured, invoiced, or estimated. A blended total with no tags tells a reviewer nothing about reliability.
Gas follows the same pattern from meter reads or invoices, converted with the factor for the year of consumption. Watch billing periods that straddle your year end. Pro-rate them and note the method, rather than booking twelve invoices that cover thirteen months.
Transport fuel for owned or controlled vehicles should trace to fuel-card statements and mileage logs. Convert litres to kWh first, then calculate tCO2e. That two-step route keeps your energy total complete, since fuel bought in litres still belongs in the kWh disclosure.
Generation and Estimated Lines
On-site generation must not be netted against consumption. Show generated kWh and exported kWh on separate lines, with an explanatory note where generation is material. Netting hides both your true demand and the benefit of the asset, and it breaks year-on-year comparison when export volumes shift.
Estimates aren't a failure. Undocumented estimates are. Where an invoice is missing, record the method, the percentage of total consumption it covers, and why you needed it.
Worked example: A landlord controlled office has no sub-meter for the final quarter. You estimate consumption from the same quarter last year, pro-rated by days occupied, state that it covers a small percentage of group electricity, and flag the landlord's service charge statement as the eventual source document.
That one note turns a gap into a defensible judgement. It's the difference between a reviewer accepting the line and sending the whole table back.
Choosing an Intensity Ratio That Holds Up
An intensity ratio needs a numerator and a denominator a reader can check. Take a simple example. If your gross emissions are 12,400 tCO2e and turnover is £310 million, dividing one by the other gives 40 tCO2e per £ million turnover. The arithmetic is trivial. Defending the denominator is the work.
| Denominator | Example ratio | Suits | Watch-out |
|---|---|---|---|
| Turnover | tCO2e per £ million turnover | Service businesses and mixed groups | Price changes and inflation move the ratio without any operational change |
| Floor area | tCO2e per square metre | Property owners, retailers and offices | Leased or landlord-controlled space must be included or excluded consistently |
| Headcount | tCO2e per full-time equivalent | Office-based professional services | Contractors and remote staff change the count |
| Output | tCO2e per tonne of product | Manufacturers and producers | Product mix changes need a stated explanation |
Turnover is the most common choice because finance already reports it and auditors can tie it to the accounts. Its weakness is price. Raise prices in an inflationary year and your ratio improves even if consumption rose, so a sharp reviewer will ask how much of the movement is operational.
Headcount suits people-based businesses, but you must define it. Full-time equivalents, average headcount, and year-end headcount give different answers, and contractors or remote staff shift the count without changing building energy. Floor area works where property drives consumption, provided leased space is treated consistently. Output is strongest for manufacturers, until product mix changes make a tonne this year unlike a tonne last year.
I would keep the same ratio each year unless the business itself has changed shape. Comparability is the point of the metric. If you do change the denominator, restate the comparative year on the new basis and state the reason in the reconciliation block, so nobody reads a methodology change as performance.
Finish with one sentence in the template explaining why the denominator reflects your organisation's activity. Write it as if a non-executive director will read it aloud. That sentence is the first thing a reviewer challenges, and a vague answer undermines an otherwise sound table.
How to Write the Energy-Efficiency Narrative
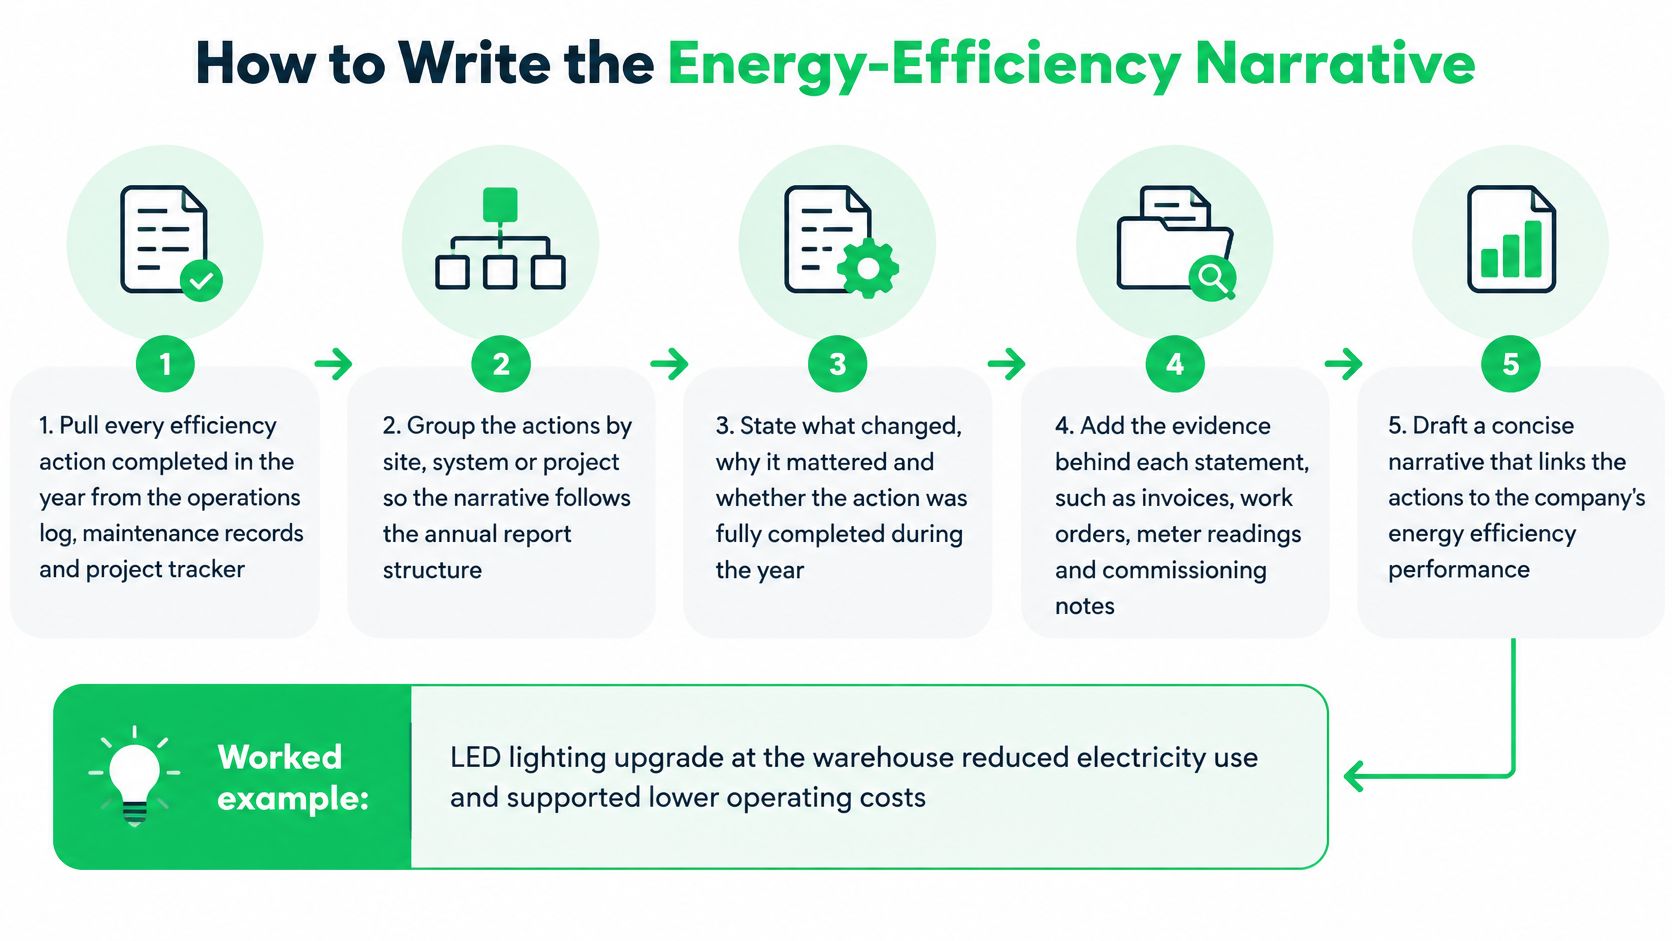
The narrative is where preparers relax, and it's usually the weakest part of the disclosure. Dates, sites, and quantities are what separate a statutory statement from brochure copy. Build it from the action register, not from memory in the week before filing.
Follow these seven steps in order:
- Pull every action: Extract each efficiency action completed in the year from the action register, project tracker, and maintenance records.
- Group by energy source: Sort actions under electricity, gas, or transport so the narrative follows your data block.
- Quantify each saving: State the kWh or tCO2e saving and label it clearly as measured or expected.
- Record date and site: Note the implementation date and the site or fleet affected for every action.
- Link the evidence: Attach the evidence reference, such as a commissioning note, invoice, or meter comparison.
- Draft three sentences: For each major action, write what changed, what it saved, and how you measured it.
- Reconcile the numbers: Check every figure in the narrative against the reconciled data block before it goes near the annual report.
What Good Wording Looks Like
Here's an illustrative example that follows the method:
In June we replaced fluorescent lighting at the Leeds warehouse with LED fittings. Metered electricity at the site fell by about 8 per cent over the following six months, a measured saving of roughly 45,000 kWh.
That works because a reader can test it. There's an action, a place, a date, a measured result, and a meter behind the claim. If the saving were a supplier's projection rather than a metered result, the same sentences would need the word expected and the basis of the estimate.
Contrast that with the wording to avoid, such as "we continue to reduce our environmental impact" or "energy efficiency remains a key focus across the group." Neither tells a director what happened, and neither can be evidenced. If no action was taken in the year, say so plainly instead of padding the space. A short honest statement survives review better than a paragraph of aspiration.
Keep part-year effects honest too. An action completed in the final quarter won't show a full year of saving in this year's figures, so state the implementation date and let the reader see why the benefit lands mainly next year. A narrative with no quantified action and no dates is the first thing a reviewer questions, because it suggests the register behind it doesn't exist.
Evidence Trail and Assurance Checks
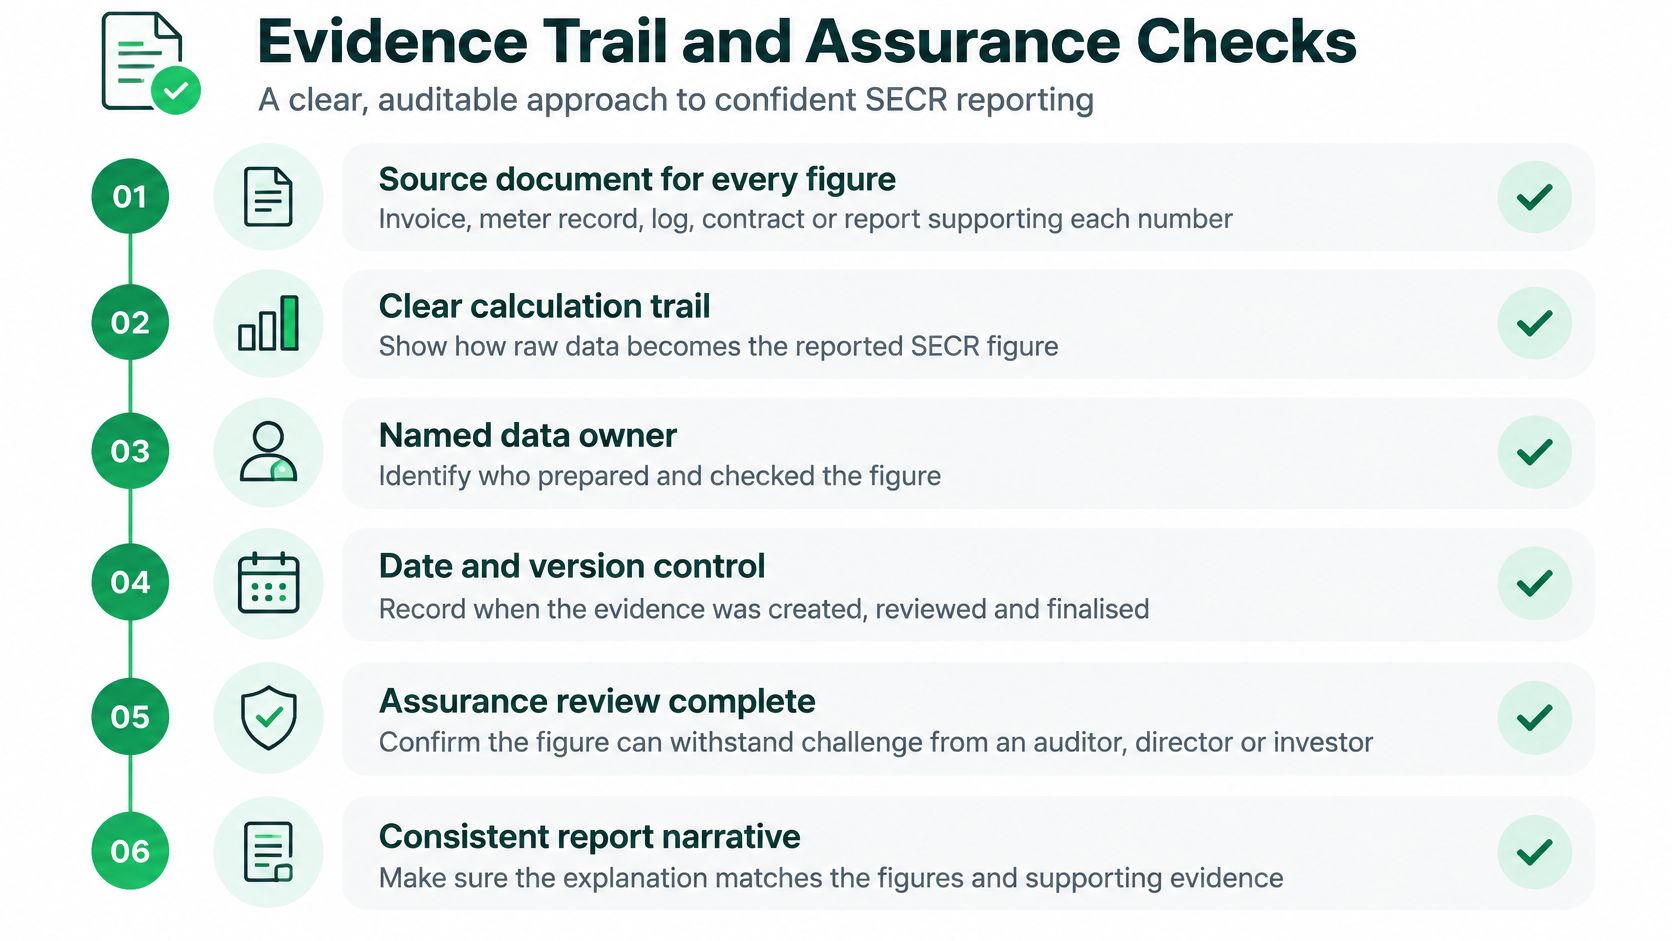
A SECR figure that cannot survive a challenge from an auditor, a director or an investor is a liability sitting in the annual report. The UK Government's SECR survey questionnaire asks organisations directly what methods they use to check the accuracy of energy-use and carbon-emissions data. Templates rarely answer that. They show where to type electricity, gas and transport fuel, but say nothing about meter gaps, estimated invoices or landlord-controlled energy.
Treat the evidence block as part of the annual-report control file, not an annex to the spreadsheet. Build it around seven checks:
- Source document: an invoice, meter read or fuel statement behind every figure, referenced by file or document number.
- Coverage percentage: meter and invoice coverage stated as a share of total consumption, so a gap is sized rather than hidden.
- Estimation method: the method used for each estimated line, with the reason it was needed.
- Reviewer sign-off: a dated check of each block by someone other than the preparer.
- Variance explanations: year-on-year movements above an agreed threshold explained in writing, not left to the reader.
- Factor version: the emissions factor version used for each conversion, recorded beside the calculation.
- Narrative reconciliation: figures agreed back to the annual report wording, including the efficiency narrative.
Restatements need their own line in the file. Show the original and amended figures side by side with the reason for the change. Overwriting last year's number destroys trust in both years, and an auditor will ask which of the two the comparative column in the accounts was built from.
More detail is not automatically better. Padding the template with unsupported Scope 3 estimates creates false precision and gives a guess the same visual authority as a metered reading. Prioritise materiality and reliability: state limitations openly, mark gaps as gaps, and spend the effort on the sources that drive the total. Every figure ESG Consulting produces traces back to source data, with the methodology, boundaries and assumptions documented for the client's auditor or assurance provider. That traceability matters more than volume.
Timing decides how much of this can still be fixed. Missing meters, unbilled sites and unclear landlord arrangements can be resolved in October. In the filing month they can only be disclosed. Run the data quality review against the checklist early enough that every row closes the year with a document reference and a reviewer's initials against it.
Confirm Your Template Before Board Sign-Off
A board pack can look complete and still fail the first question from finance: where did this number come from? SECR disclosures sit in statutory annual reports, so treat the template as a control document. Every field should carry its evidence, estimation method and sign-off, not only a figure. A workable sign-off runs in four stages. The sustainability preparer completes data and methodology. Finance checks every figure against the ledger. Company secretarial confirms the disclosure sits correctly in the Directors' Report or annual report. The board approves what has already been tested. That sequence is recommended practice. Its value is that each stage leaves a named owner and a dated check.
Before sign-off, work through one page. Applicability note signed. Boundary mapped with exclusions explained. Every line tagged by scope with a dated factor. Intensity ratio stated with its denominator and rationale. Efficiency narrative matched to the action register. Evidence references complete and restatements explained. If any item fails, the template is not ready, however polished the table looks. A board approval without those checks certifies a document nobody has reconciled.
For a complex group, patchy data or an assurance review, get the draft template reviewed before it reaches the board. ESG Consulting's SECR service covers Scope 1 and 2 inventories, intensity ratios and the energy efficiency narrative required in the annual report. Engagements move through scoping, data collection, drafting and sign-off, with the lead consultant on every stage. Enquiries sent through the contact form at esgconsulting.co.uk receive a reply within one working day.
Keep two artefacts in the file: the signed template and the signed applicability note. Those are what defend the disclosure long after filing day.
If your draft SECR reporting template has gaps in its boundary, evidence or narrative, we can review it against your source data and rebuild the blocks that will not survive scrutiny. Visit ESG Consulting to discuss your reporting perimeter, your Scope 1 and 2 figures, and the sign-off trail your board will expect to see.