carbon footprint business, Scope 3 emissions, SECR reporting, carbon accounting, GHG Protocol
Carbon Footprint Business
By ESG Consulting Team · · 16 min read
A sustainability lead is asked to “get the numbers ready” for the annual report. Finance wants a figure that reconciles to the accounts, procurement wants supplier data for a tender, operations wants a list of energy-saving projects, and the board wants to know whether the business is reducing emissions. The same footprint is expected to answer every question, but nobody has agreed what decision it needs to support.
That's where many carbon footprint business projects go wrong. Teams collect meter readings, invoices and supplier questionnaires for months, then produce a technically respectable total that doesn't tell anyone which site to upgrade, which contract to change or which investment to approve. A useful footprint isn't just a number of tonnes of CO2e. It's a controlled evidence base for decisions.
Table of Contents
- Start With the Decision Your Footprint Must Support
- Setting Organisational and Operational Boundaries
- Understanding Scope 1, Scope 2 and Scope 3 Emissions
- Collecting Activity Data and Calculating Tonnes of CO2e
- Tackling Scope 3 Without Pretending Estimates Are Precise
- Building an Evidence Trail That Survives Assurance
- Practitioner Tips, Common Mistakes and Your Next Move
Start With the Decision Your Footprint Must Support
Before opening a spreadsheet, write a short purpose statement. It should identify the decision, the users, the reporting boundary and the action that could follow from the result.
A workable statement might read: “This inventory will support the annual SECR disclosure, identify the facilities and vehicle activities suitable for near-term decarbonisation investment, and provide a defensible baseline for supplier engagement.” That wording is more useful than “calculate our carbon footprint”, because it tells the team what data matters and what level of precision is justified.
The decision might be regulatory. SECR began on 1 April 2019 and requires quoted companies and qualifying large UK companies and LLPs to disclose annual energy use, greenhouse-gas emissions and energy-efficiency actions in their annual reports, as confirmed by the UK Government's SECR reporting guidance. It might be commercial, such as preparing a Carbon Reduction Plan for a public-sector tender under PPN 06/21. It might involve capital allocation, procurement requirements, an acquisition or a transition plan.
A compliant disclosure can still leave management without a usable pathway. One group-level figure may conceal a highly energy-intensive plant, a leased estate with incomplete records, an outsourced logistics operation or a recently acquired business whose emissions haven't been brought into the baseline. More granular data isn't automatically better. It's better only when it changes a decision.

Ask what the number must change
Use the purpose statement to decide which questions the inventory must answer:
- Procurement: Which categories or suppliers should receive primary-data requests, contract conditions or lower-carbon alternatives?
- Investment: Which sites, fleets or processes deserve funding, and how will the board distinguish efficiency from business growth?
- Compliance: Which emissions and energy disclosures belong in the annual report, and what evidence will support them?
- Tendering: Does the inventory align with the relevant Carbon Reduction Plan boundary and customer requirements?
- Risk management: Which outsourced, leased or value-chain activities could create exposure that site energy data won't show?
A useful footprint may therefore need different views of the same controlled dataset. Finance may need absolute tonnes and a reconciliation. Operations may need emissions by site and source. Procurement may need emissions by category and supplier. The calculation should be designed around those uses from the beginning.
The video below provides useful context for the relationship between carbon measurement and business action.
Practical rule: If nobody can name the decision that a better figure would improve, stop collecting detail and fix the scope first.
Setting Organisational and Operational Boundaries
A footprint starts with a boundary memo, not a conversion factor. The memo should explain which legal entities, sites, assets and activities are included, which accounting approach has been selected and how changes will be handled.
Choose the organisational boundary
The main approaches are equity share, financial control and operational control. Equity share follows the organisation's ownership interest. Financial control follows the entities whose financial and operating policies the organisation can direct. Operational control follows the operations where it has authority to introduce and implement operating policies.
There isn't one universally correct choice for every group. The correct choice is the one that fits the reporting purpose, is applied consistently and can be explained to reviewers. A quoted group may need to distinguish the boundary used for its corporate inventory from the boundary required for its annual report. An unquoted company or LLP may have different SECR reporting requirements depending on whether it meets at least two statutory thresholds, more than 250 employees, over £36 million turnover, or over £18 million balance sheet total, as set out in the UK sustainability reporting guidance for 2025 to 2026.
Acquisitions require a documented treatment. If a company acquires a business during the year, decide whether the acquired operations enter the inventory from the transaction date or through another stated policy. Then apply that policy consistently and explain any effect on comparability. Changing the organisational boundary without recalculating the base year makes an apparent increase or decrease impossible to interpret.
Define the operational boundary
List the sources controlled or influenced by the organisation:
- Buildings: Offices, factories, warehouses, laboratories and community sites, including leased premises where relevant.
- Energy: Electricity, gas, oil, district heat, steam and cooling purchased or generated.
- Transport: Owned and controlled vehicles, employee travel, business travel, logistics and delivery arrangements.
- Assets: Refrigeration, air-conditioning, leased equipment, generators and process plant.
- Value chain: Purchased goods and services, capital goods, waste, commuting, downstream distribution, product use and investments where material.
Consider an NHS trust with leased community sites. The trust may not own the buildings, but it may pay for energy, control day-to-day operations and hold relevant utility records. Excluding the sites only because the title sits elsewhere could produce a misleading operational picture. Conversely, an outsourced logistics arm may sit outside operational control while remaining highly material to the organisation's value chain. That activity shouldn't disappear. It should be classified and documented appropriately.
SECR is a reporting foundation, not a complete value-chain inventory. Its core requirements focus principally on reported energy consumption and associated emissions, while Scope 3 includes other indirect emissions connected with goods and services across the supply chain.
Use a boundary memo
Keep the memo short enough that a reviewer can understand it quickly. Include:
- Purpose: The decisions and disclosures the inventory supports.
- Entities: Included and excluded legal entities, with the reason for each exclusion.
- Sites and assets: Facilities, fleets, leased assets and operational activities included.
- Method: Equity share, financial control or operational control.
- Scope treatment: Scope 1, Scope 2 and relevant Scope 3 categories.
- Change policy: Acquisitions, disposals, outsourcing and base-year restatements.
- Owners: The people responsible for source data, review and approval.
That memo prevents a common failure: producing a polished total before anyone has agreed what the total represents.
Understanding Scope 1, Scope 2 and Scope 3 Emissions
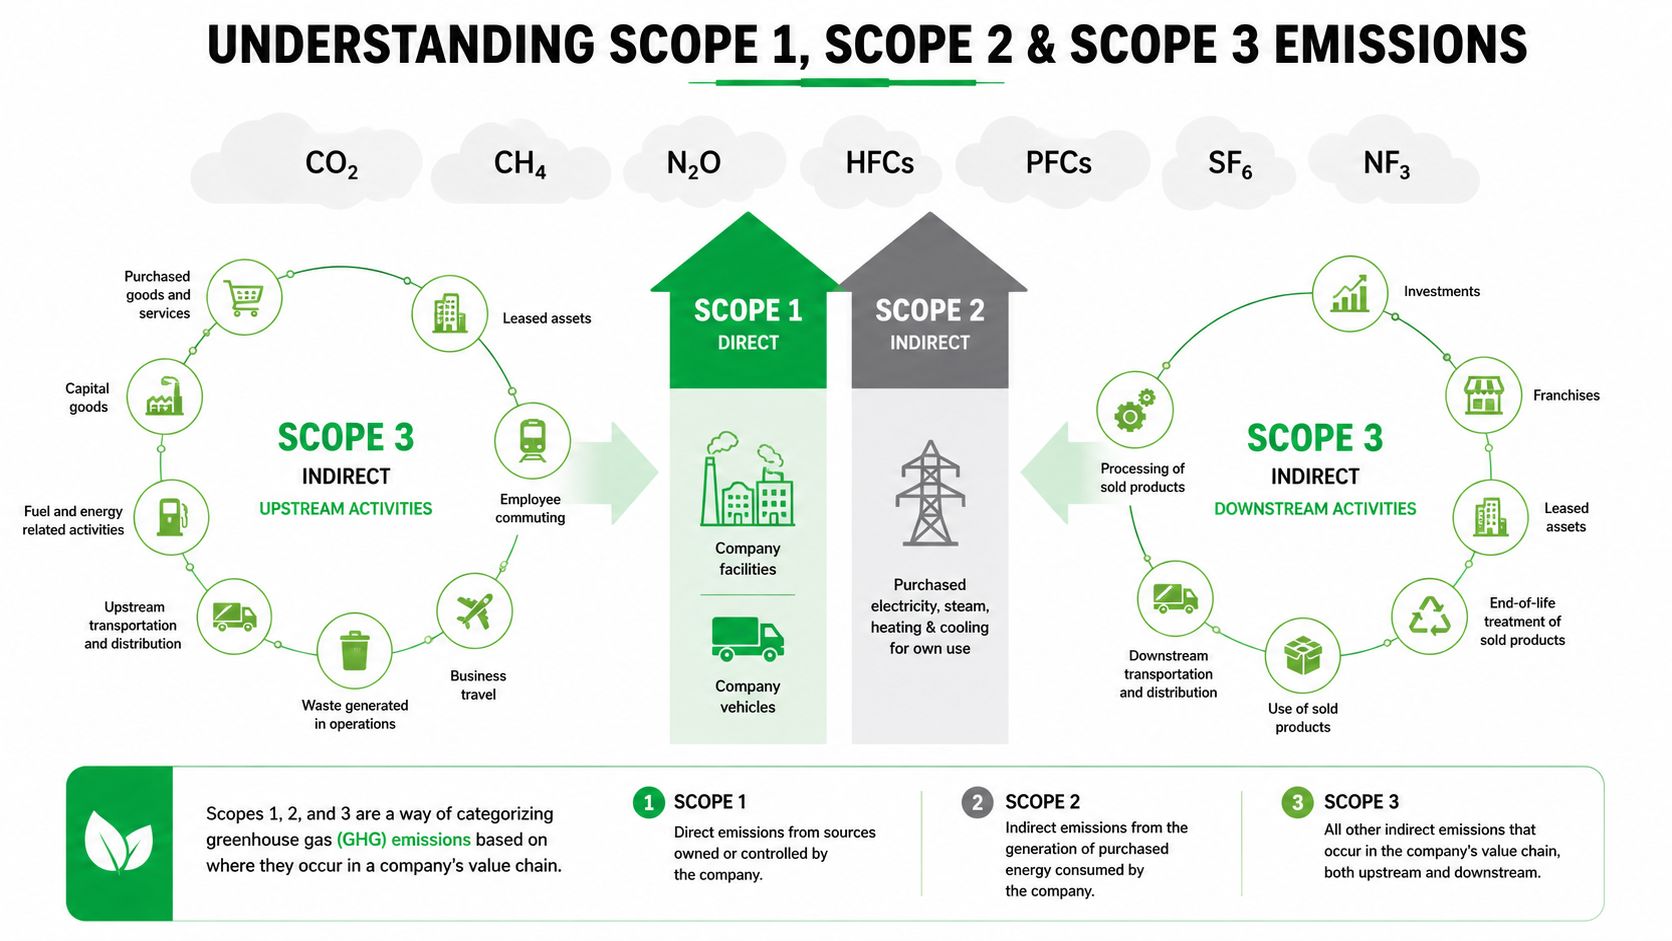
The three-scope model is useful because it separates emissions by the organisation's relationship with the source.
Scope 1 covers direct emissions from sources the organisation owns or controls. Examples include natural gas burned in a company boiler, fuel used in an owned vehicle fleet, refrigerant leakage and emissions from industrial processes. Facilities and fleet teams usually hold much of this data, although refrigerants and backup generators are often missed.
Scope 2 covers indirect emissions from purchased energy. Electricity is the familiar example, but purchased heat and steam can also be relevant. Electricity reporting may involve a location-based method, which reflects the average emissions intensity of the grid, and a market-based method, which reflects contractual instruments and supplier-specific information. The organisation must state which method it uses and avoid mixing the two in a way that makes year-on-year comparisons unclear.
Scope 3 covers other indirect emissions across the value chain. The GHG Protocol structure contains 15 categories, extending from purchased goods and services and capital goods to fuel- and energy-related activities, transport, waste, business travel, employee commuting, leased assets, processing and use of sold products, end-of-life treatment, franchises and investments. A practical explanation of the categories is available in this guide to what Scope 3 emissions include.
Use national data as a sanity check
UK territorial emissions don't contain a single “business” category. In 2024, net territorial greenhouse-gas emissions were estimated at approximately 373 MtCO2e, down 3% from 2023 and 53%, or 417 MtCO2e, below the 1990 baseline, according to the UK Government's 2024 greenhouse-gas emissions statistics. Carbon dioxide represented about 78% of the total.
The largest territorial source was domestic transport at 30%, followed by buildings and product uses at 22%, agriculture at 12%, industry at 12%, electricity supply at 10%, fuel supply at 8% and waste at 6%, based on the same release. These sectors overlap with corporate activities in different ways. A manufacturer may have fuel and process emissions in Scope 1, purchased electricity in Scope 2, and materials, freight and product use in Scope 3. A professional services firm may have little Scope 1 activity but still have material purchased services, commuting, business travel and leased-office emissions.
The ONS also estimated 478 MtCO2e of UK residence-based emissions in 2024, a measure that includes emissions generated by UK residents and UK-registered businesses domestically and overseas. That distinction matters for internationally exposed supply chains. Electricity bills are an input, not a footprint. A credible source list must include the activities that create value for the organisation, wherever those activities occur.
Collecting Activity Data and Calculating Tonnes of CO2e
The calculation itself is straightforward. The difficult work is selecting the right activity data, matching it to the right factor and preserving the evidence.
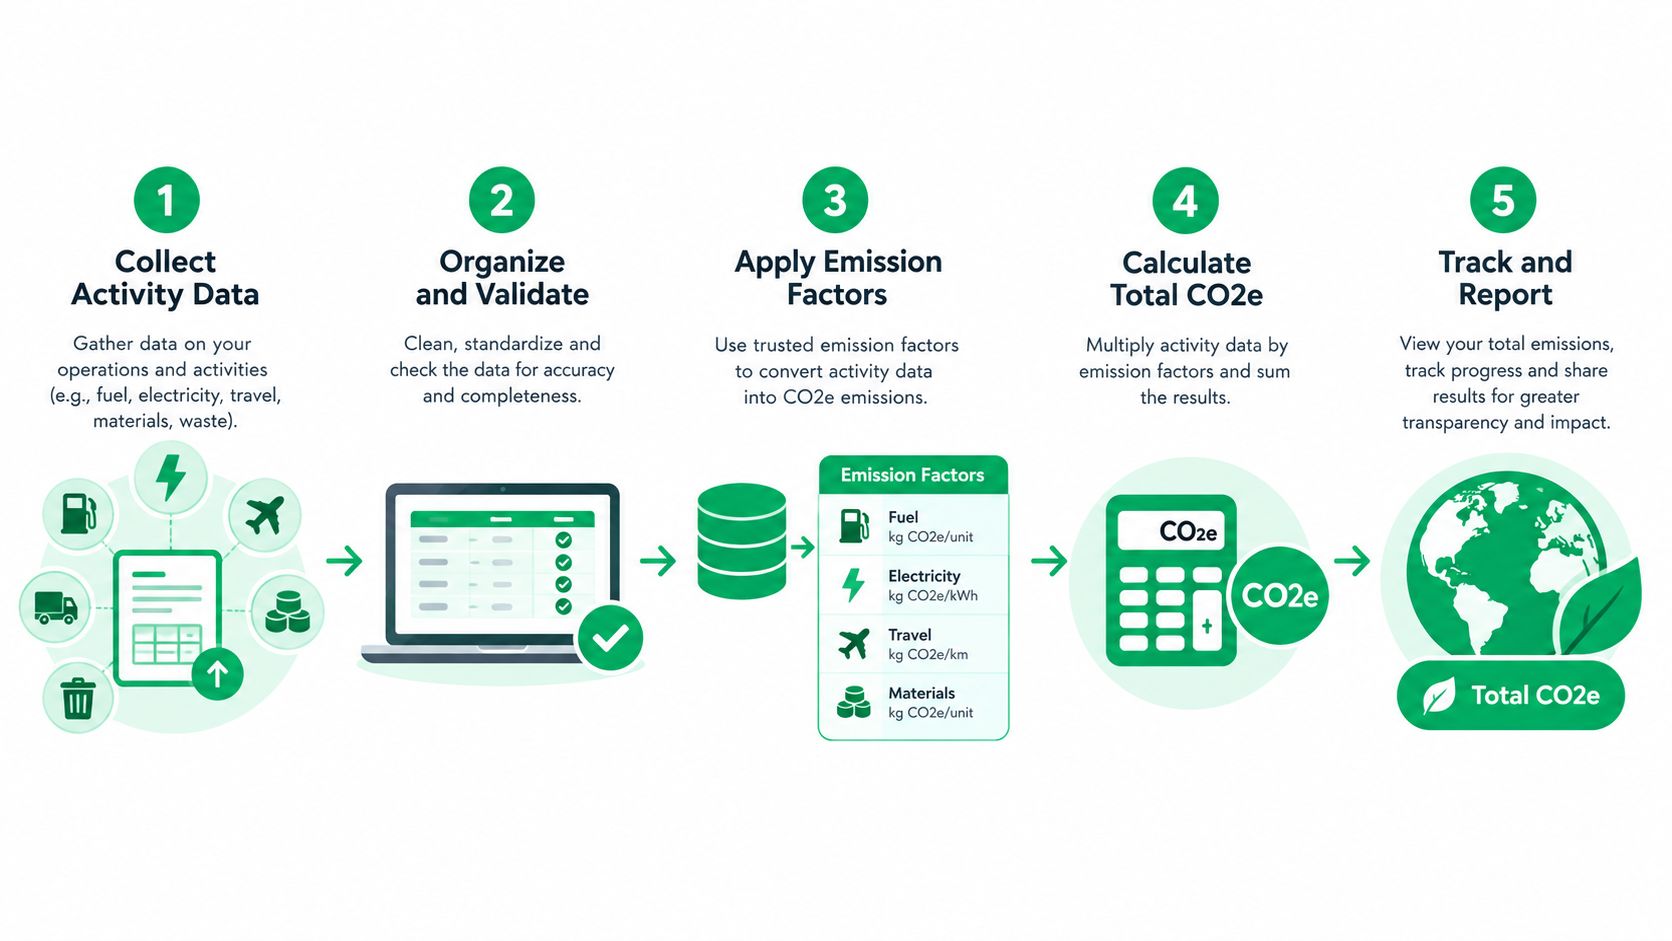
A repeatable workflow looks like this:
- Define organisational and operational boundaries.
- Classify sources into Scope 1, Scope 2 and relevant Scope 3 categories.
- Collect primary activity data, such as litres of fuel, kWh of electricity, kilometres travelled, tonnes of waste and procurement spend.
- Select the matching UK Government 2025 greenhouse-gas conversion factor.
- Multiply the activity quantity by the factor, convert kilograms to tonnes where necessary, aggregate the results and retain the supporting evidence.
The UK Government's 2025 GHG conversion-factor methodology covers energy, water, waste, transport and other activities and is intended to support SECR-related reporting. Use the published AR5 100-year global-warming potentials consistently, rather than combining factor sets with different methodological bases.
A practical calculation example
Take a small office-and-fleet company. The facilities manager provides electricity in kWh, the fleet manager provides fuel in litres, the travel coordinator provides business-travel kilometres, and the facilities contractor provides waste in tonnes. Each activity is assigned the matching factor for the reporting year.
The calculation for each source is:
Activity data × relevant conversion factor = kg CO2e
The results are then divided by the appropriate unit conversion and aggregated into total tonnes of CO2e. The office and fleet example should produce separate subtotals before consolidation, so a reviewer can see whether the result came from electricity, fuel, travel or waste. That structure also lets management test an action, such as replacing vehicles or changing an electricity contract, without rebuilding the entire inventory.
A broader introduction to emissions governance and reduction planning is available in this guide to carbon management.
Controls that prevent false precision
Several errors appear repeatedly in assurance reviews:
- Electricity methods get mixed: Location-based and market-based results are calculated or presented inconsistently.
- Spend factors lose their context: The model doesn't record the price year, currency basis or procurement category behind the spend.
- Refrigerants disappear: Maintenance records are treated as irrelevant even where leakage is material.
- Leased assets are omitted: The team assumes ownership is the only test, rather than checking control and reporting boundaries.
- Factor versions change without notice: A new factor set is used without restating the comparison year or documenting the effect.
Freeze the factor set by reporting year. The government identifies changes above 5% for many Scope 1 and Scope 2 sources and above 10% for many Scope 3 sources as major changes in its methodology. If a factor change crosses the relevant threshold, document the restatement rather than presenting the movement as operational performance.
At board level, show absolute tonnes of CO2e and an intensity ratio. Absolute emissions show the climate burden. An intensity ratio helps management interpret performance when economic activity, output or floor area changes. The chosen denominator must be relevant, stable and clearly reconciled to the underlying activity.
Tackling Scope 3 Without Pretending Estimates Are Precise
Scope 3 work stalls when teams treat the first inventory as a final answer. A better approach is a staged programme: screen broadly, prioritise deliberately, improve the evidence where it can change a decision and report the remaining uncertainty openly.
Only 33% of organisations in the 2024 UK Net Zero Business Census reported measuring a complete baseline covering Scopes 1, 2 and 3, according to the 2024 UK Net Zero Business Census report. That result supports a pragmatic approach. Start by screening all 15 categories with spend-based or supplier-based estimates, rank them by estimated emissions and decision relevance, then improve the categories that matter most.
| Scope 3 Category | Typical Data Source | Estimation Method |
|---|---|---|
| Purchased goods and services | Procurement ledger, supplier records and product data | Spend-based screening, then supplier-specific or activity-based data |
| Capital goods | Fixed-asset register, project costs and contractor information | Spend-based estimate, then material and project-level data |
| Upstream transport | Freight invoices, logistics records and shipment data | Spend or distance-based estimate, then carrier activity data |
| Waste generated in operations | Waste transfer notes and contractor reports | Weight-based calculation, with documented assumptions for missing streams |
| Business travel | Travel-management reports and expense records | Distance or spend-based estimate, then route and mode data |
| Employee commuting | Staff survey and workforce data | Survey-based estimate with transparent coverage and assumptions |
| Use of sold products | Product sales, technical specifications and use profiles | Activity-based model, with sensitivity analysis where user behaviour varies |
| End-of-life treatment | Product composition, sales and disposal assumptions | Material and treatment-based estimate, then customer or waste-operator data |
The largest estimated categories often have the weakest evidence. A procurement estimate can identify a hotspot, but it shouldn't be presented as if every supplier has supplied measured emissions.
Turn uncertainty into an action plan
For each material category, report:
- Data-quality grade: Primary, supplier-specific, activity-based or spend-based.
- Methodology: The factor source, calculation logic and allocation approach.
- Coverage: The proportion of the category supported by the selected evidence.
- Uncertainty narrative: The assumptions most likely to affect the result.
- Next action: The supplier, data field or process that will improve the estimate.
Supplier requests should ask for product carbon footprints, organisational and operational boundaries, factor sources, verification status and reporting period. Procurement should also check for double counting between purchased goods, transport, leased assets and fuel-related activities.
A transparent estimate with limitations is more useful to a buyer, lender or NHS customer than a precise-looking figure built on opaque assumptions. The point of better data isn't cosmetic accuracy. It's to decide which supplier, material, contract or product change deserves attention first.
Building an Evidence Trail That Survives Assurance
An assurance-ready inventory lets a reviewer trace a reported figure back to the source record without relying on the analyst's memory. That means storing the input, the assumption, the factor, the calculation and the approval in a controlled structure.
Retain:
- Source documents: Invoices, meter records, fuel statements, travel reports, waste notes and procurement extracts.
- Boundary evidence: Entity lists, site registers, lease information, acquisition dates and exclusions.
- Method notes: Activity definitions, spend categories, allocation rules and estimation assumptions.
- Factor control: Factor name, reporting year, version, unit and date of adoption.
- Calculation controls: Formula checks, input validation, duplicate checks and review sign-offs.
- Reconciliation: A clear path from source data to scope totals, subtotals, intensity ratios and the final disclosure.
One 2025 UK reporting example expanded coverage by adding purchased goods and services and upstream leased assets for the first time, while using spend-based factors where procurement data couldn't yet be disaggregated. That is a credible maturity pattern when the change is disclosed clearly. Scope 3 inventories improve over time, and a newly included category may increase the reported footprint without representing an operational deterioration.
Control changes and restatements
Keep a reporting-year register of factors and boundaries. If a factor changes materially, record the old and new result, the reason for the change and whether the base year needs restatement. Apply the same logic to acquisitions, disposals, outsourcing and changes in data coverage.
PPN 06/21 adds a procurement dimension. A Carbon Reduction Plan may require specified Scope 3 categories and minimum boundaries, but it isn't automatically identical to a full GHG Protocol inventory. Map the procurement boundary against the corporate inventory and explain inclusions, exclusions and any differences rather than forcing two different disclosures into one unexplained number.
An assurance-ready sustainability audit process should test whether every material figure has an owner, source, method and review trail. It should also challenge unsupported supplier claims and confirm that uncertainty is visible to the intended reader.
A good evidence trail doesn't hide uncertainty. It shows where uncertainty sits, why it exists and what management will do about it.
Practitioner Tips, Common Mistakes and Your Next Move
The most reliable inventories follow a few practical rules:
- Fix the decision first: Don't ask for granular data until you know whether the output supports compliance, procurement, investment or operational reduction.
- Freeze the factor set: Use one controlled factor set for the reporting year and document any restatement caused by a material change.
- Show two board views: Present absolute tonnes of CO2e alongside a relevant intensity ratio.
- Improve the top three categories: Set an annual data-improvement target for the highest-priority Scope 3 categories, while keeping the boundary and calculation logic stable.
- Separate reduction from methodology: A change in coverage, factor or boundary isn't the same as a genuine emissions reduction.
- Check applicability: Confirm whether an obligation applies before commissioning unnecessary work. Knowing when a rating can be deferred is also useful advice.
Before submission, check that:
- Entity and site lists agree with finance and property records.
- Leased assets, refrigerants, acquisitions and outsourced activities have a documented treatment.
- Electricity methods are identified and used consistently.
- Spend-based estimates include price-year assumptions.
- Every material category has a data-quality grade and uncertainty note.
- The final disclosure reconciles to source data and approved calculations.
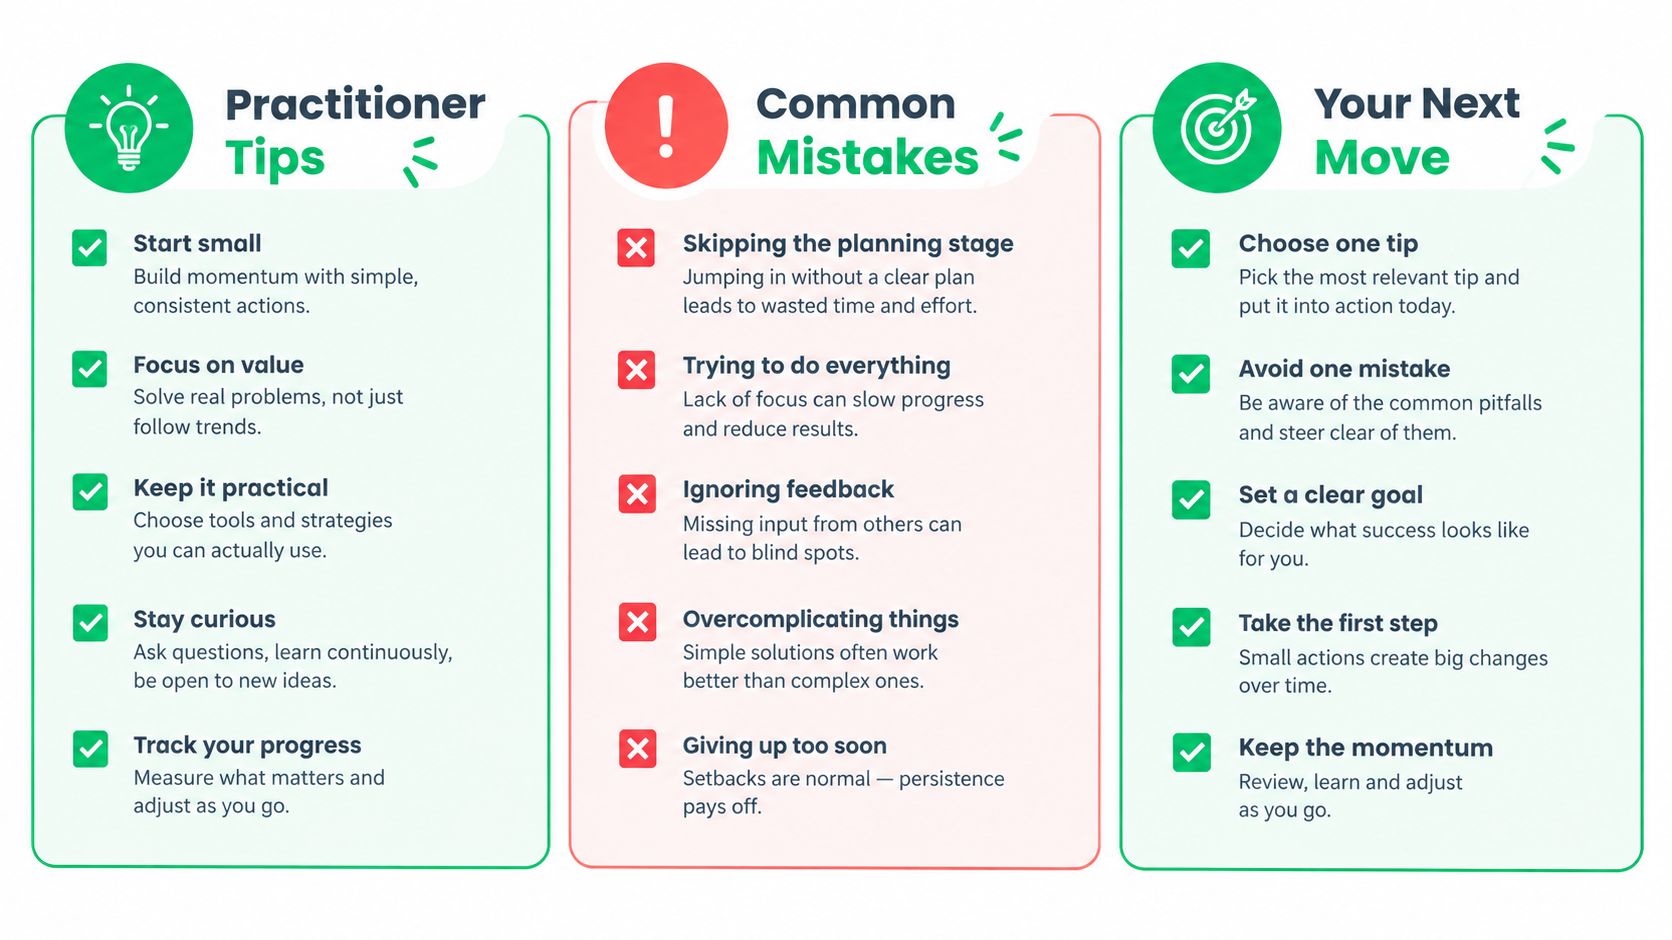
Your next move can be concrete. This week, write the purpose statement, draft the boundary memo and list the ten largest emission sources using a rough, clearly labelled estimate. That will give you a decision-led starting point instead of another data request that nobody knows how to use.
A credible business carbon footprint is a decision instrument, not a reporting ritual. It earns trust when the boundary is clear, the calculations are reproducible and the uncertainty leads to action.
ESG Consulting helps UK organisations build SECR inventories, map Scope 3 emissions, prepare PPN 06/21 Carbon Reduction Plans and develop costed decarbonisation pathways with evidence trails designed for scrutiny. If your footprint needs to support a board decision, procurement requirement or NHS customer, visit ESG Consulting to discuss the right scope and next step.