
net zero strategy, SBTi net zero, TPT transition plan, Scope 3 emissions, carbon reporting UK
Net Zero Strategy How to Build a Credible UK Plan
By ESG Consulting Team · · 15 min read
The UK has already cut emissions by 50.4% against 1990 levels, including international aviation and shipping, yet the country still has 26 years to reach its 2050 deadline. The Climate Change Committee says emissions have fallen by an average of 18 MtCO2e per year since 2008, but that progress doesn't make the remaining pathway straightforward. It makes one point unavoidable: a credible net zero strategy must manage delivery, evidence and policy risk, not just publish an ambition statement. (Climate Change Committee progress report 2025)
For UK organisations, the hard work starts after the pledge. Boards need a defensible baseline, finance teams need a costed investment case, procurement teams need supplier evidence, and reporting teams need controls that can withstand scrutiny. A pathway that depends on an assumed grid connection, an unconfirmed grant or incomplete Scope 3 data isn't a transition plan. It's an exposure disguised as a strategy.
Table of Contents
- What a Credible Net Zero Strategy Must Deliver in the UK
- Building an Auditable Emissions Baseline That Holds Up
- Modelling Your Pathway With SBTi and TPT Alignment
- Sequencing Abatement and Costing the Investment Plan
- Governing Delivery and Keeping Disclosures Assurance Ready
- Putting Your Net Zero Strategy Into Action
What a Credible Net Zero Strategy Must Deliver in the UK
The legal foundation is clear. The Climate Change Act, amended in 2019, made the UK's 2050 net zero target legally binding and requires greenhouse gas emissions to fall by at least 100% from 1990 levels by 2050. The framework also establishes sequential carbon budgets, with the sixth carbon budget covering 2033 to 2037 and requiring a 78% reduction by 2035 against 1990 levels, including the UK's share of international aviation and shipping. (Climate Change Committee overview of UK climate action)
That architecture matters to businesses because it provides the policy context for capital planning, procurement requirements, energy investment and disclosure. The government's Net Zero Strategy and Net Zero Growth Plan translate the statutory target into sectoral pathways and delivery milestones. A corporate plan that ignores those pathways may still look technically credible, but it won't explain how the organisation will operate through changes in electricity supply, building standards, transport policy, heat deployment or public procurement.
The policy gap belongs in the risk register
National progress doesn't remove execution risk. The Climate Action Tracker assessment of the UK indicates that only 38% of the emissions reductions needed for the 2030 target are covered by credible policies. A further 61% is covered by policies carrying delivery or funding risks, while 39% of required cuts remain inadequately covered. The figures overlap because the categories describe different degrees of policy confidence, so strategy teams should read them as a warning about coverage quality rather than as a simple scorecard.
The practical consequence is significant. Don't build a corporate pathway around the assumption that every enabling condition will arrive on schedule. Record dependencies explicitly, assign an owner to each one and model what happens if a grid upgrade, funding mechanism, planning approval or supplier commitment arrives late.
Define “done” before modelling starts
A strategy is ready for board and external scrutiny when it can answer five questions:
- What is the baseline? Boundaries, sources, factors, estimates and exclusions are documented.
- What must change? Targets cover relevant emissions and distinguish genuine abatement from neutralisation.
- Who delivers it? Each major action has an accountable owner, budget, timing and decision gate.
- What could delay it? Policy, grid, workforce, supplier and technology dependencies are visible.
- What proves progress? KPIs, evidence trails, recalculation rules and reporting responsibilities are fixed.
That definition moves net zero from a communications document into a controlled delivery system. Investors, auditors and public-sector buyers don't need a perfect forecast. They need a transparent plan that distinguishes committed actions from assumptions, and measured reductions from claims that remain unverified.
Building an Auditable Emissions Baseline That Holds Up
A baseline isn't just an emissions total. It's the controlled starting point for targets, investment decisions and disclosures. If the organisation can't show how the figure was assembled, who approved it and which source records support it, the number may be unsuitable for assurance even if the arithmetic is correct.
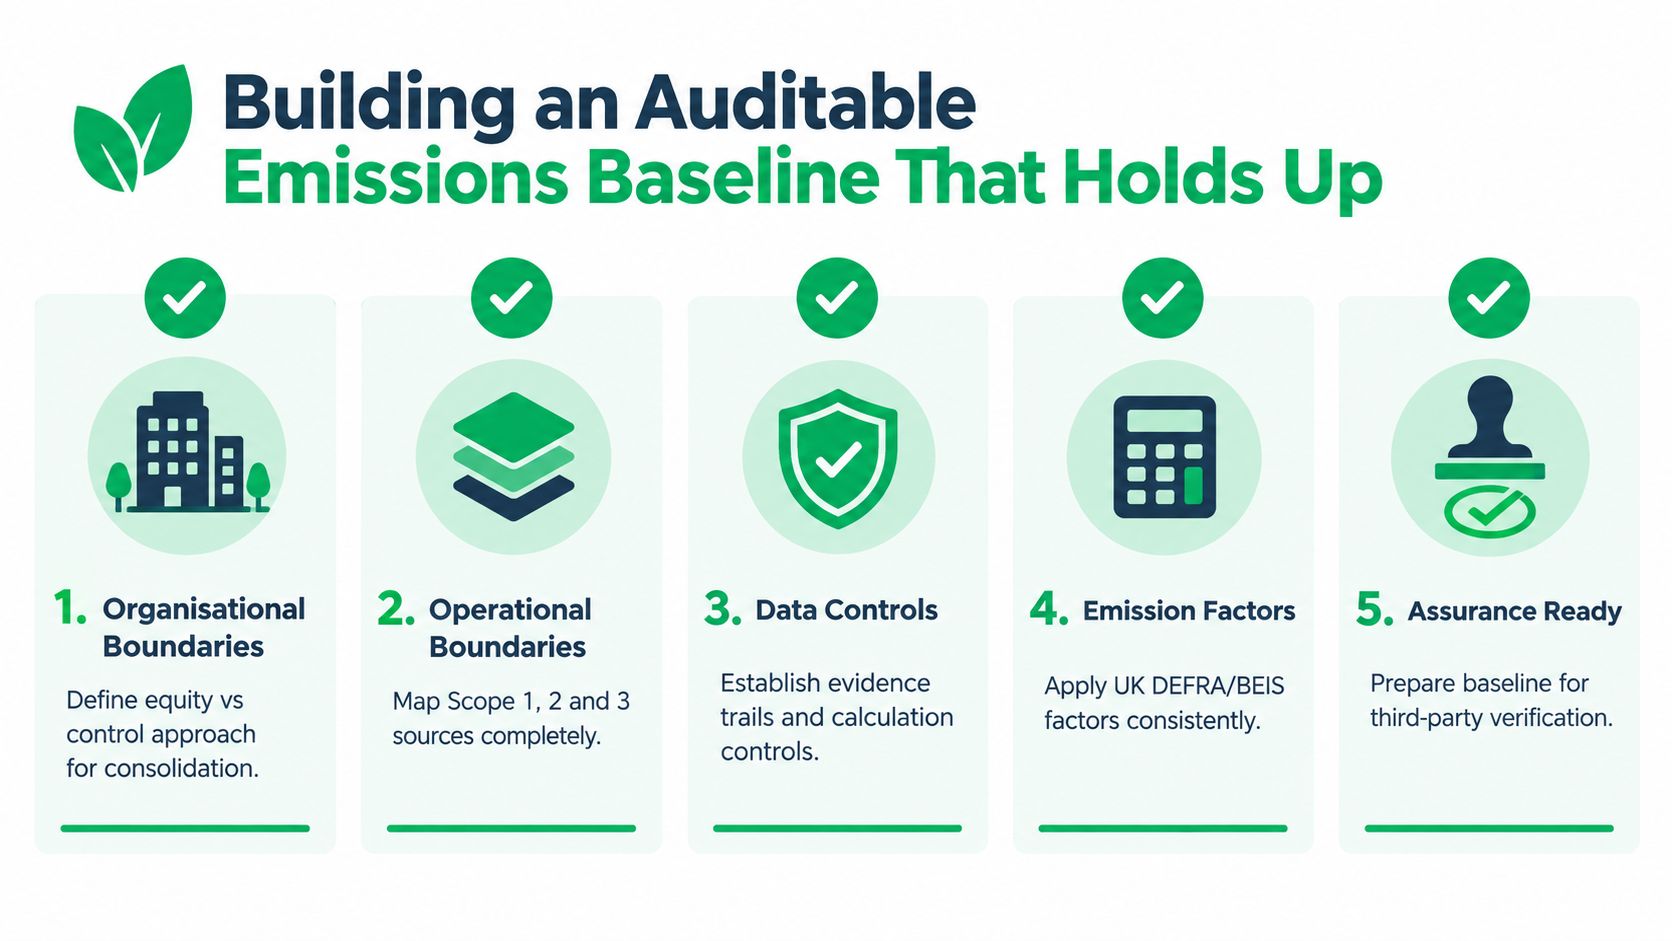
Start by defining the organisational boundary. Decide whether consolidation follows an equity share, financial control or operational control approach, then apply that approach consistently across subsidiaries, leased sites, joint ventures and outsourced operations. Keep a register of entities and facilities, including acquisitions, disposals, closures and newly occupied premises. Boundary decisions should be approved before data collection begins, not improvised when a reporting deadline approaches.
Build the inventory as a control framework
Map operational sources across Scope 1, Scope 2 and Scope 3. Scope 1 typically includes fuel burned in owned or controlled equipment and company vehicles. Scope 2 covers purchased energy, while Scope 3 requires a value-chain assessment covering relevant upstream and downstream categories. A useful explanation of category boundaries and supplier data considerations is available in this guide to what Scope 3 emissions include.
Use a data hierarchy rather than treating every input as equally reliable:
- Primary activity data, such as meter readings, invoices, fuel records and procurement extracts.
- Supplier-specific emissions data, where the supplier can explain its methodology and provide supporting evidence.
- Activity-based estimates, using quantities such as spend, distance, weight or energy consumption.
- Screening estimates, used temporarily to identify material sources that need better data.
Label each figure with its source, period, unit, conversion method and reviewer. A spreadsheet containing a final number but no evidence trail is not a controlled inventory.
Choose and protect the base year
Select a base year that has complete, representative data and a stable organisational boundary. Document why it was chosen. Then define recalculation triggers, such as a material acquisition, disposal, structural boundary change, methodology change or discovery of a material error.
The exact threshold for recalculation should be set in the methodology and approved by the reporting owner. Don't change the base year because a later year looks more favourable. That weakens comparability and creates avoidable questions during assurance.
| Control area | What to retain |
|---|---|
| Activity data | Bills, meter exports, fleet records and procurement reports |
| Emission factors | Factor version, source, unit and application date |
| Calculations | Formula logic, conversions, aggregation and review checks |
| Estimates | Assumption, rationale, uncertainty and improvement plan |
| Approvals | Owner, reviewer, sign-off date and unresolved exceptions |
For UK reporting, keep intensity ratios and the underlying denominator aligned with the organisation's SECR methodology. A ratio without a controlled revenue, floor-area, headcount or other denominator can create a misleading trend even when the emissions numerator is sound. The baseline should therefore be reviewed by finance and operational owners, not left solely with sustainability staff.
A short walkthrough can help non-specialists understand the mechanics of emissions accounting:
The final test is reproducibility. Another competent person should be able to take the source pack, follow the methodology and reach the reported result without relying on undocumented judgement.
Modelling Your Pathway With SBTi and TPT Alignment
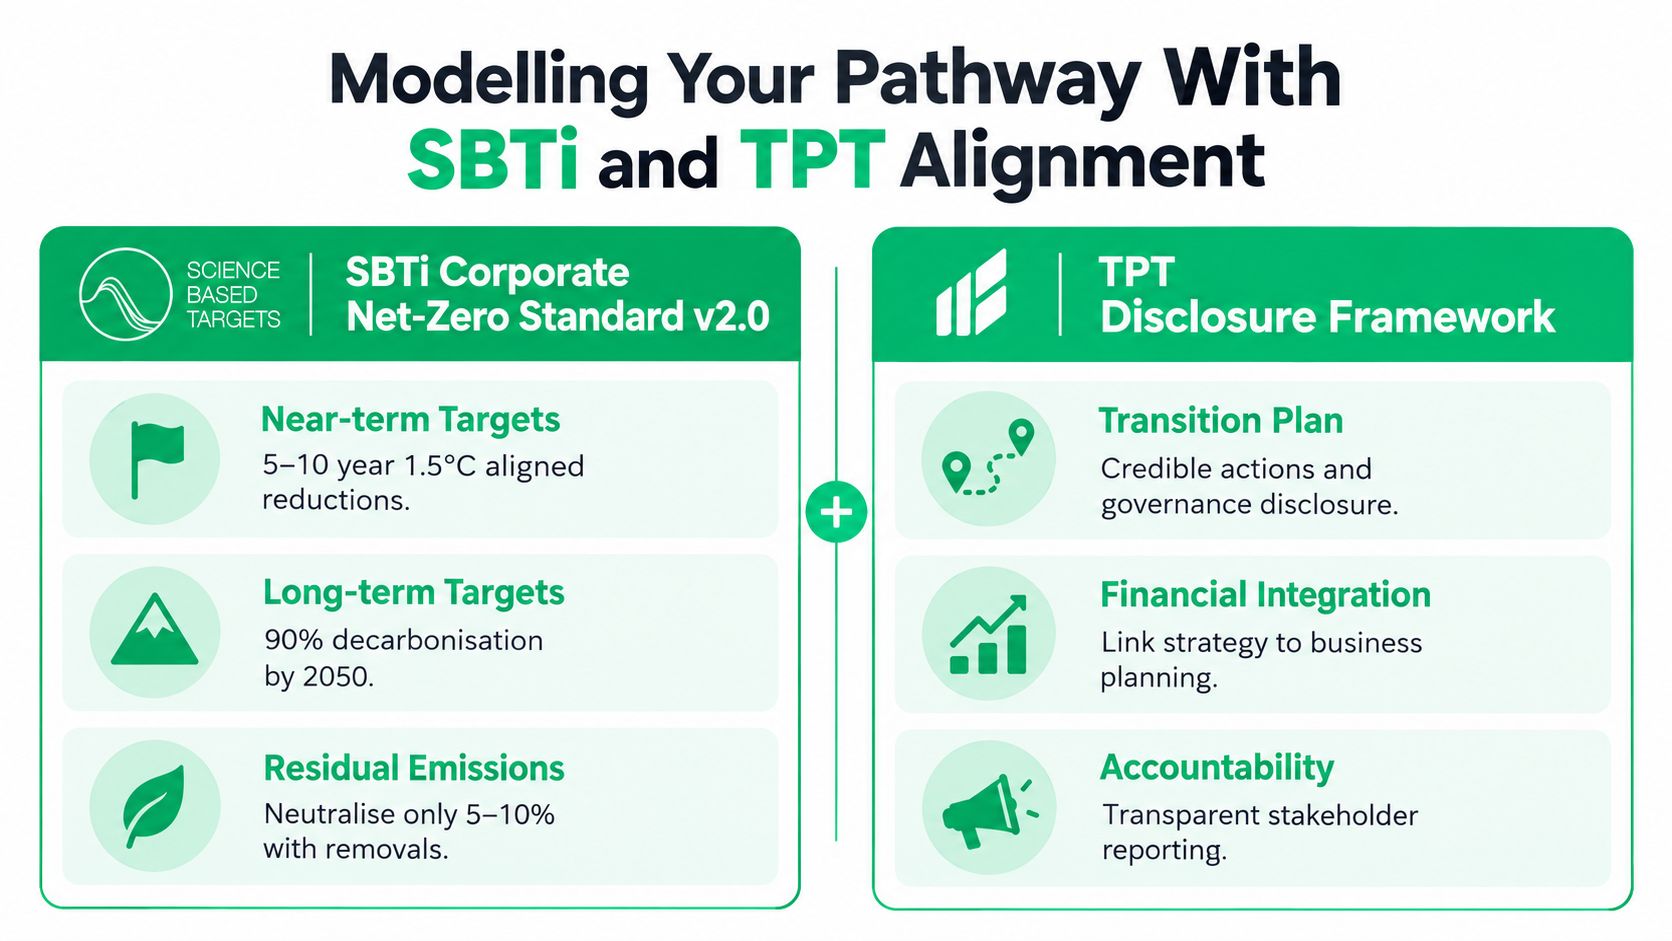
SBTi and TPT solve different problems, so choosing between them is usually the wrong question. The SBTi Corporate Net-Zero Standard v2.0 provides target architecture. The Transition Plan Taskforce framework provides a structure for explaining how the organisation will govern, finance and execute that architecture.
Use SBTi to set the reduction spine
SBTi modelling helps establish near-term and long-term emissions targets that are aligned with climate science. The Corporate Net-Zero Standard v2.0 framework is commonly used to structure 5 to 10-year near-term targets, long-term decarbonisation and the treatment of residual emissions. The target model should make clear whether reductions are absolute or intensity-based, which scopes are included and how sector-specific pathways affect the calculation.
Absolute targets are often easier for boards and investors to interpret because they track total emissions. Intensity targets can be useful where output, patient activity, floor area or production volume changes materially, but they mustn't conceal rising total emissions. For a hospital trust, for example, an intensity measure may support operational analysis, while absolute emissions remain necessary for understanding the overall climate impact.
Residual emissions should sit at the end of the abatement hierarchy. Removals aren't a substitute for energy efficiency, electrification, procurement changes or process redesign. Treat them as a controlled response to emissions that remain technically difficult to eliminate, with the assumptions and quality criteria documented separately from operational reductions.
Use TPT to make the pathway investable
TPT asks whether the transition plan is connected to governance, business planning, capital allocation, risk management and stakeholder communication. That makes it particularly useful for organisations whose target model is technically sound but operationally thin.
A TPT-aligned plan should show:
- Strategic intent, including the business changes required to deliver the target.
- Implementation actions, with owners, milestones, dependencies and funding.
- Financial integration, linking climate measures to capital expenditure, operating expenditure and expected asset lives.
- Governance and accountability, including board oversight and management responsibilities.
- Metrics and reporting, with definitions that reconcile to the emissions inventory.
The two frameworks can share one controlled data model. SBTi supplies the reduction logic, while TPT explains the management system around it. Avoid creating separate target calculations for sustainability reporting and a separate transition-plan workbook for finance. That duplication produces inconsistent numbers and makes assurance harder.
Stress-test the model against UK conditions
A pathway that works in a spreadsheet may fail in delivery. Test assumptions against the UK's carbon budgets, sectoral policy milestones and relevant climate-related scenarios. Scenario analysis should expose sensitivity to electricity prices, grid availability, technology lead times, building constraints, supply-chain response and policy delays.
The result shouldn't be a single heroic curve. Use a core pathway with clearly identified contingencies, then define the trigger that causes management to move to an alternative measure. This approach gives the board a decision framework rather than false precision.
Sequencing Abatement and Costing the Investment Plan
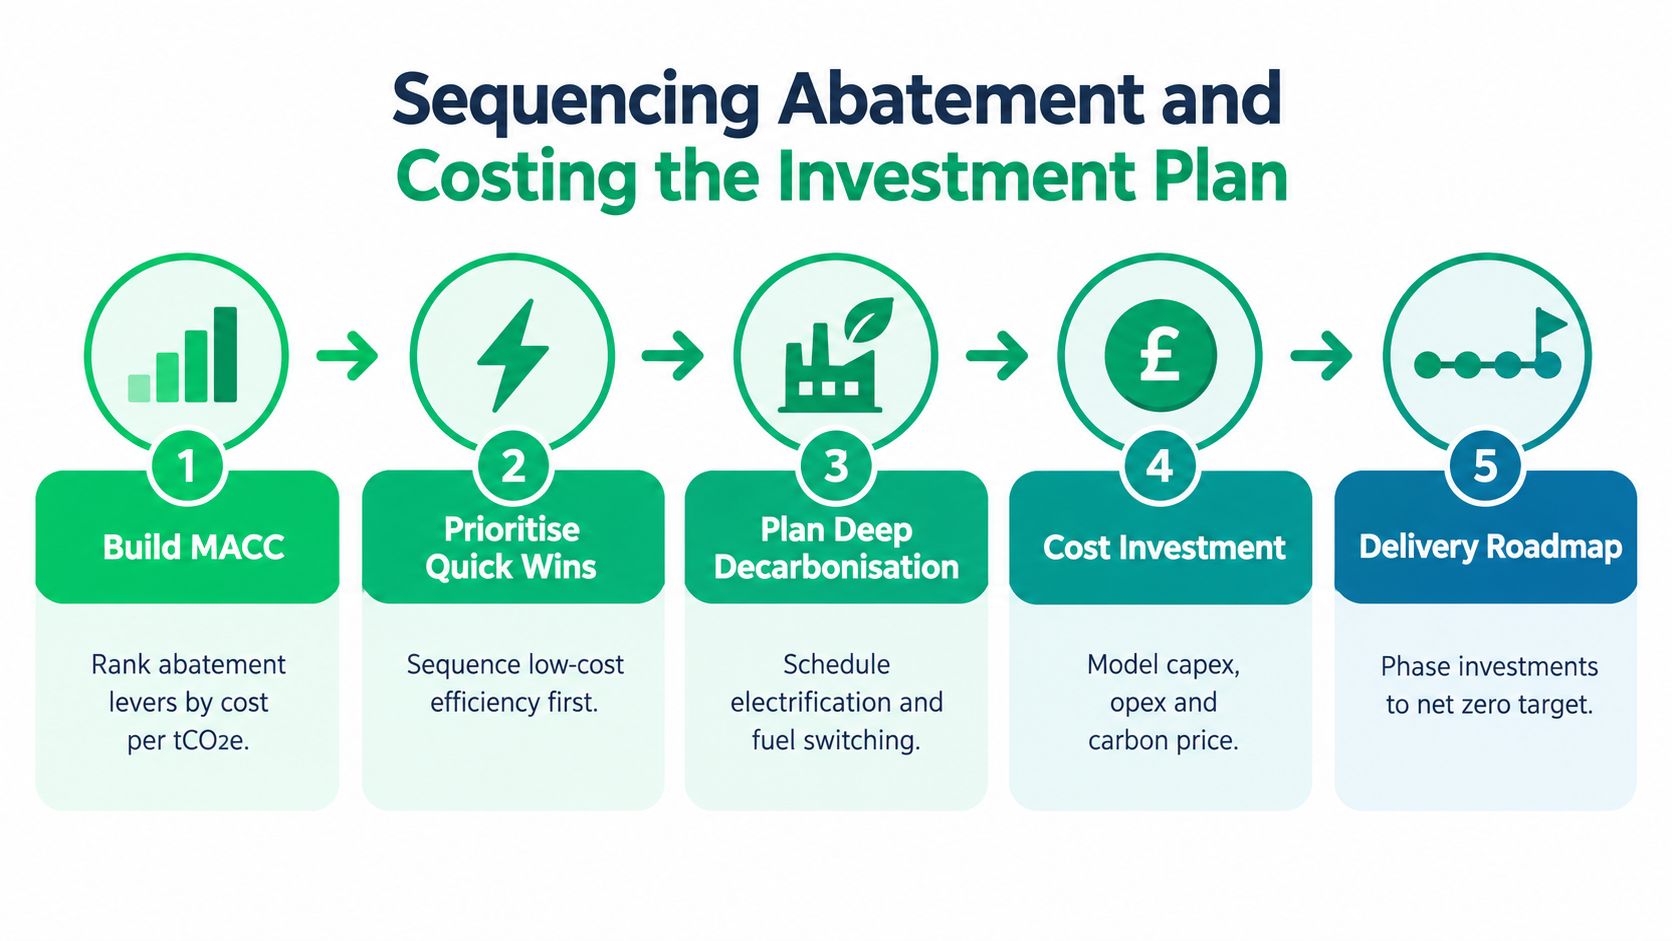
Technical potential does not determine the investment order. A practical plan ranks measures by emissions impact, cost, readiness and dependency risk, then converts that ranking into decisions that finance and operations can execute. A structured decarbonisation strategy helps rank measures by cost, readiness and dependency risk while keeping the pathway tied to delivery conditions.
Start with a marginal abatement cost curve, but treat it as a decision aid rather than an automatic investment schedule. Show estimated cost per tCO2e, capital requirements, operating impact, useful life, delivery lead time and confidence in the underlying data. Add a separate readiness assessment. A low-cost measure that lacks a grid connection or qualified installer is not a near-term abatement option.
Apply a delivery-first sequence
Begin with measures that reduce demand and improve control. Building management optimisation, maintenance, heat-loss reduction, process efficiency, metering and fleet utilisation can produce early reductions while larger projects are developed. They also improve the operating data used to size and approve later investments.
Schedule infrastructure-dependent projects next, including electrification, heat pumps, charging networks and industrial fuel switching. Before placing a project in the committed pipeline, identify grid capacity, connection dates, planning requirements, workforce availability and equipment lead times. If any of these remain unresolved, record the dependency, owner and decision date rather than presenting the project as certain.
Practical rule: If a project depends on an unconfirmed connection, grant or supplier capability, show it as conditional, not committed.
For Scope 3, sequence interventions according to the organisation's influence. Procurement specifications, supplier questionnaires, contract clauses, category-level engagement and product redesign can run in parallel, but each needs a different owner. Supplier intention alone does not support a value-chain abatement claim. Define the evidence that qualifies as a reduction, how it will be calculated and what happens when a supplier does not respond.
Separate commitment from possibility
UK corporate decarbonisation data shows why delivery discipline matters. In 2023, average annual reductions were 6% for Scopes 1 and 2 and 2% for Scope 3, down from 9% and 8% respectively in 2022. Companies with climate transition plans decarbonised faster, at 8.3% per year versus 3.9% without such plans, while adding key enablers lifted performance by a further 3 to 6 percentage points per year. (Bain's analysis of UK corporate decarbonisation)
These rates are not a target to copy without examining the conditions behind them. The practical lesson is that planning quality and delivery enablers affect results. For each major reduction, identify the required procurement authority, capital approval, data access, technical skills and supplier cooperation. Record what evidence will show that the enabler is in place.
Cost the pathway in finance language
For every material measure, record:
- Capital expenditure, including design, installation, enabling works and contingency.
- Operating expenditure, covering maintenance, energy, licences and staffing.
- Financial effect, such as savings, avoided exposure, asset value or service resilience.
- Carbon effect, with the calculation method and confidence rating.
- Decision gate, specifying the evidence required before approval.
- Fallback option, if policy, funding or infrastructure does not arrive.
The UK policy situation makes this level of discipline necessary. The Climate Change Committee's 2026 progress report identifies no progress on four recommendations and some but insufficient progress on 17 others. Businesses should not wait for every policy dependency to resolve. Invest first in measures within organisational control, preserve options for infrastructure-dependent projects and escalate external dependencies through formal risk governance.
A separate analysis of faster electrification and UK net zero delivery argues that faster electrification can put money back into households' pockets, while highlighting infrastructure, grid connection queues, skills shortages and withdrawn grant streams. Organisations should prepare projects early, secure technical evidence and cost the deployable option, rather than selecting the cheapest theoretical technology. The investment plan should show which projects are committed, which remain conditional and what evidence will move each one between those categories.
Governing Delivery and Keeping Disclosures Assurance Ready
A net zero strategy loses value when ownership ends at board approval. The operating model should make delivery visible every month, while formal reporting confirms progress at the appropriate governance level.
Name one accountable executive owner. That person doesn't need to calculate every emissions figure, but they must control the decision log, approve material assumptions, resolve cross-functional conflicts and report exceptions to the board. Give each major workstream a delivery owner in operations, estates, procurement, fleet, finance or IT. Sustainability should coordinate the system, not carry every action alone.
Create a small set of controlled measures
Use an internal dashboard with measures that link directly to the pathway:
- Emissions performance, split by scope and material source.
- Energy and activity drivers, such as consumption, fleet use, floor area or production.
- Project delivery, including milestones, budget variance and carbon impact.
- Data quality, showing primary data coverage, estimates and unresolved exceptions.
- Policy dependencies, including owner, status and contingency.
- Supplier response, separating engagement activity from verified emissions improvement.
Set interim carbon budgets at organisational and business-unit level. Review them alongside financial budgets so management sees carbon variance as an operating issue rather than an annual sustainability exercise.
Align the reporting evidence
Different disclosures may use different requirements, but the underlying facts should reconcile. Map the emissions inventory and governance evidence across SECR, UK SRS S1 and S2, CFD and TCFD, and PPN 006 where relevant. For an NHS organisation, connect the plan to the Green Plan, estates programme, procurement controls and supplier expectations rather than presenting net zero as a separate report.
The sustainability reporting consultant service can support organisations that need to align carbon data, narrative disclosures and evidence trails across these frameworks.
Keep an assurance pack with the approved methodology, source files, factor register, calculation workbook, boundary decisions, management approvals and explanations for estimates. Add a change log. When a figure changes, record what changed, why it changed, who approved it and whether prior periods need recalculation.
Assurance insight: Reviewers usually find weaknesses in the chain of evidence, not in the ambition statement.
Set a regular cadence. Operational owners review data and actions throughout the year. Finance challenges costs and assumptions. The executive owner reviews delivery risks. The board receives a concise exception report, with decisions required rather than a long list of activities. Re-engage suppliers when category methods, contracts or reporting expectations change.
Putting Your Net Zero Strategy Into Action
A useful 90-day mobilisation plan is deliberately practical.
Days one to thirty: confirm the organisational boundary, freeze the baseline methodology, gather source evidence and list every major policy or infrastructure dependency. Identify gaps that could affect target-setting or assurance, then assign owners.
Days thirty-one to sixty: model the reduction pathway, test absolute and intensity views, build the abatement curve and obtain early estimates from estates, procurement, fleet, operations and finance. Classify measures as committed, conditional or exploratory.
Days sixty-one to ninety: convert the model into an investment roadmap, approve governance responsibilities, define dashboard measures and prepare the board paper. Include downside scenarios, not just the preferred pathway, and document where the organisation depends on government delivery or supplier action.
Avoid three familiar failures. Don't use offsets to conceal weak operational abatement. Don't treat an unconfirmed policy measure as a funded project. Don't publish Scope 3 targets while relying on supplier data that nobody has tested.
Seek senior consultant or Lead Assessor input when the baseline contains material estimates, the organisational boundary is complex, the strategy supports regulated reporting or a procurement submission depends on its accuracy. The right time for review is before the board signs off, not after a challenge from an auditor, investor or public-sector buyer.
Communicate the final strategy differently to each audience. Procurement needs supplier requirements and escalation routes. Investors need governance, capital allocation and delivery evidence. Operational teams need project owners, dates and decision rights. A net zero strategy creates value only when people can act on it.
ESG Consulting helps UK organisations turn emissions data into costed, sequenced net zero pathways, with support across SBTi, TPT, SECR, UK SRS, CFD and procurement disclosures. If your plan depends on uncertain grid capacity, incomplete supplier data or evidence that must withstand assurance, visit ESG Consulting to discuss a practical route from baseline to board-approved delivery.
More from the blog
· 12 min read · Regulation
What is PPN 026? The new Social Value Model
PPN 026 replaces PPN 002 as the Social Value Model for central government contracts from 1 January 2027. Scope, the 10% and 20% weightings and the six criteria.
Read article
· 14 min read · Regulation
UK ESG reporting deadlines for 2026 and 2027
Every UK ESG reporting date to December 2027 - UK SRS, ESOS, SECR, UK CBAM, CSRD, SBTi, PPN 026 and the NHS - each marked mandatory, proposed or voluntary.
Read article